
EXPLORING CHURCH SPACES
Saranya Sathananthan, Researcher in Residence

Challenges and Solutions for Maximizing Church Spaces in Boston
While many churches in Boston share their space with congregations, nonprofits, or community members, several barriers prevent them from fully utilizing their properties for mission.

What happens when church buildings close?
Churches faced with aging buildings, lack of parking, and aging, dispersed membership may find selling their buildings necessary—or even advantageous. What happens to the buildings when they do?

Opportunities for Leveraging Church Spaces
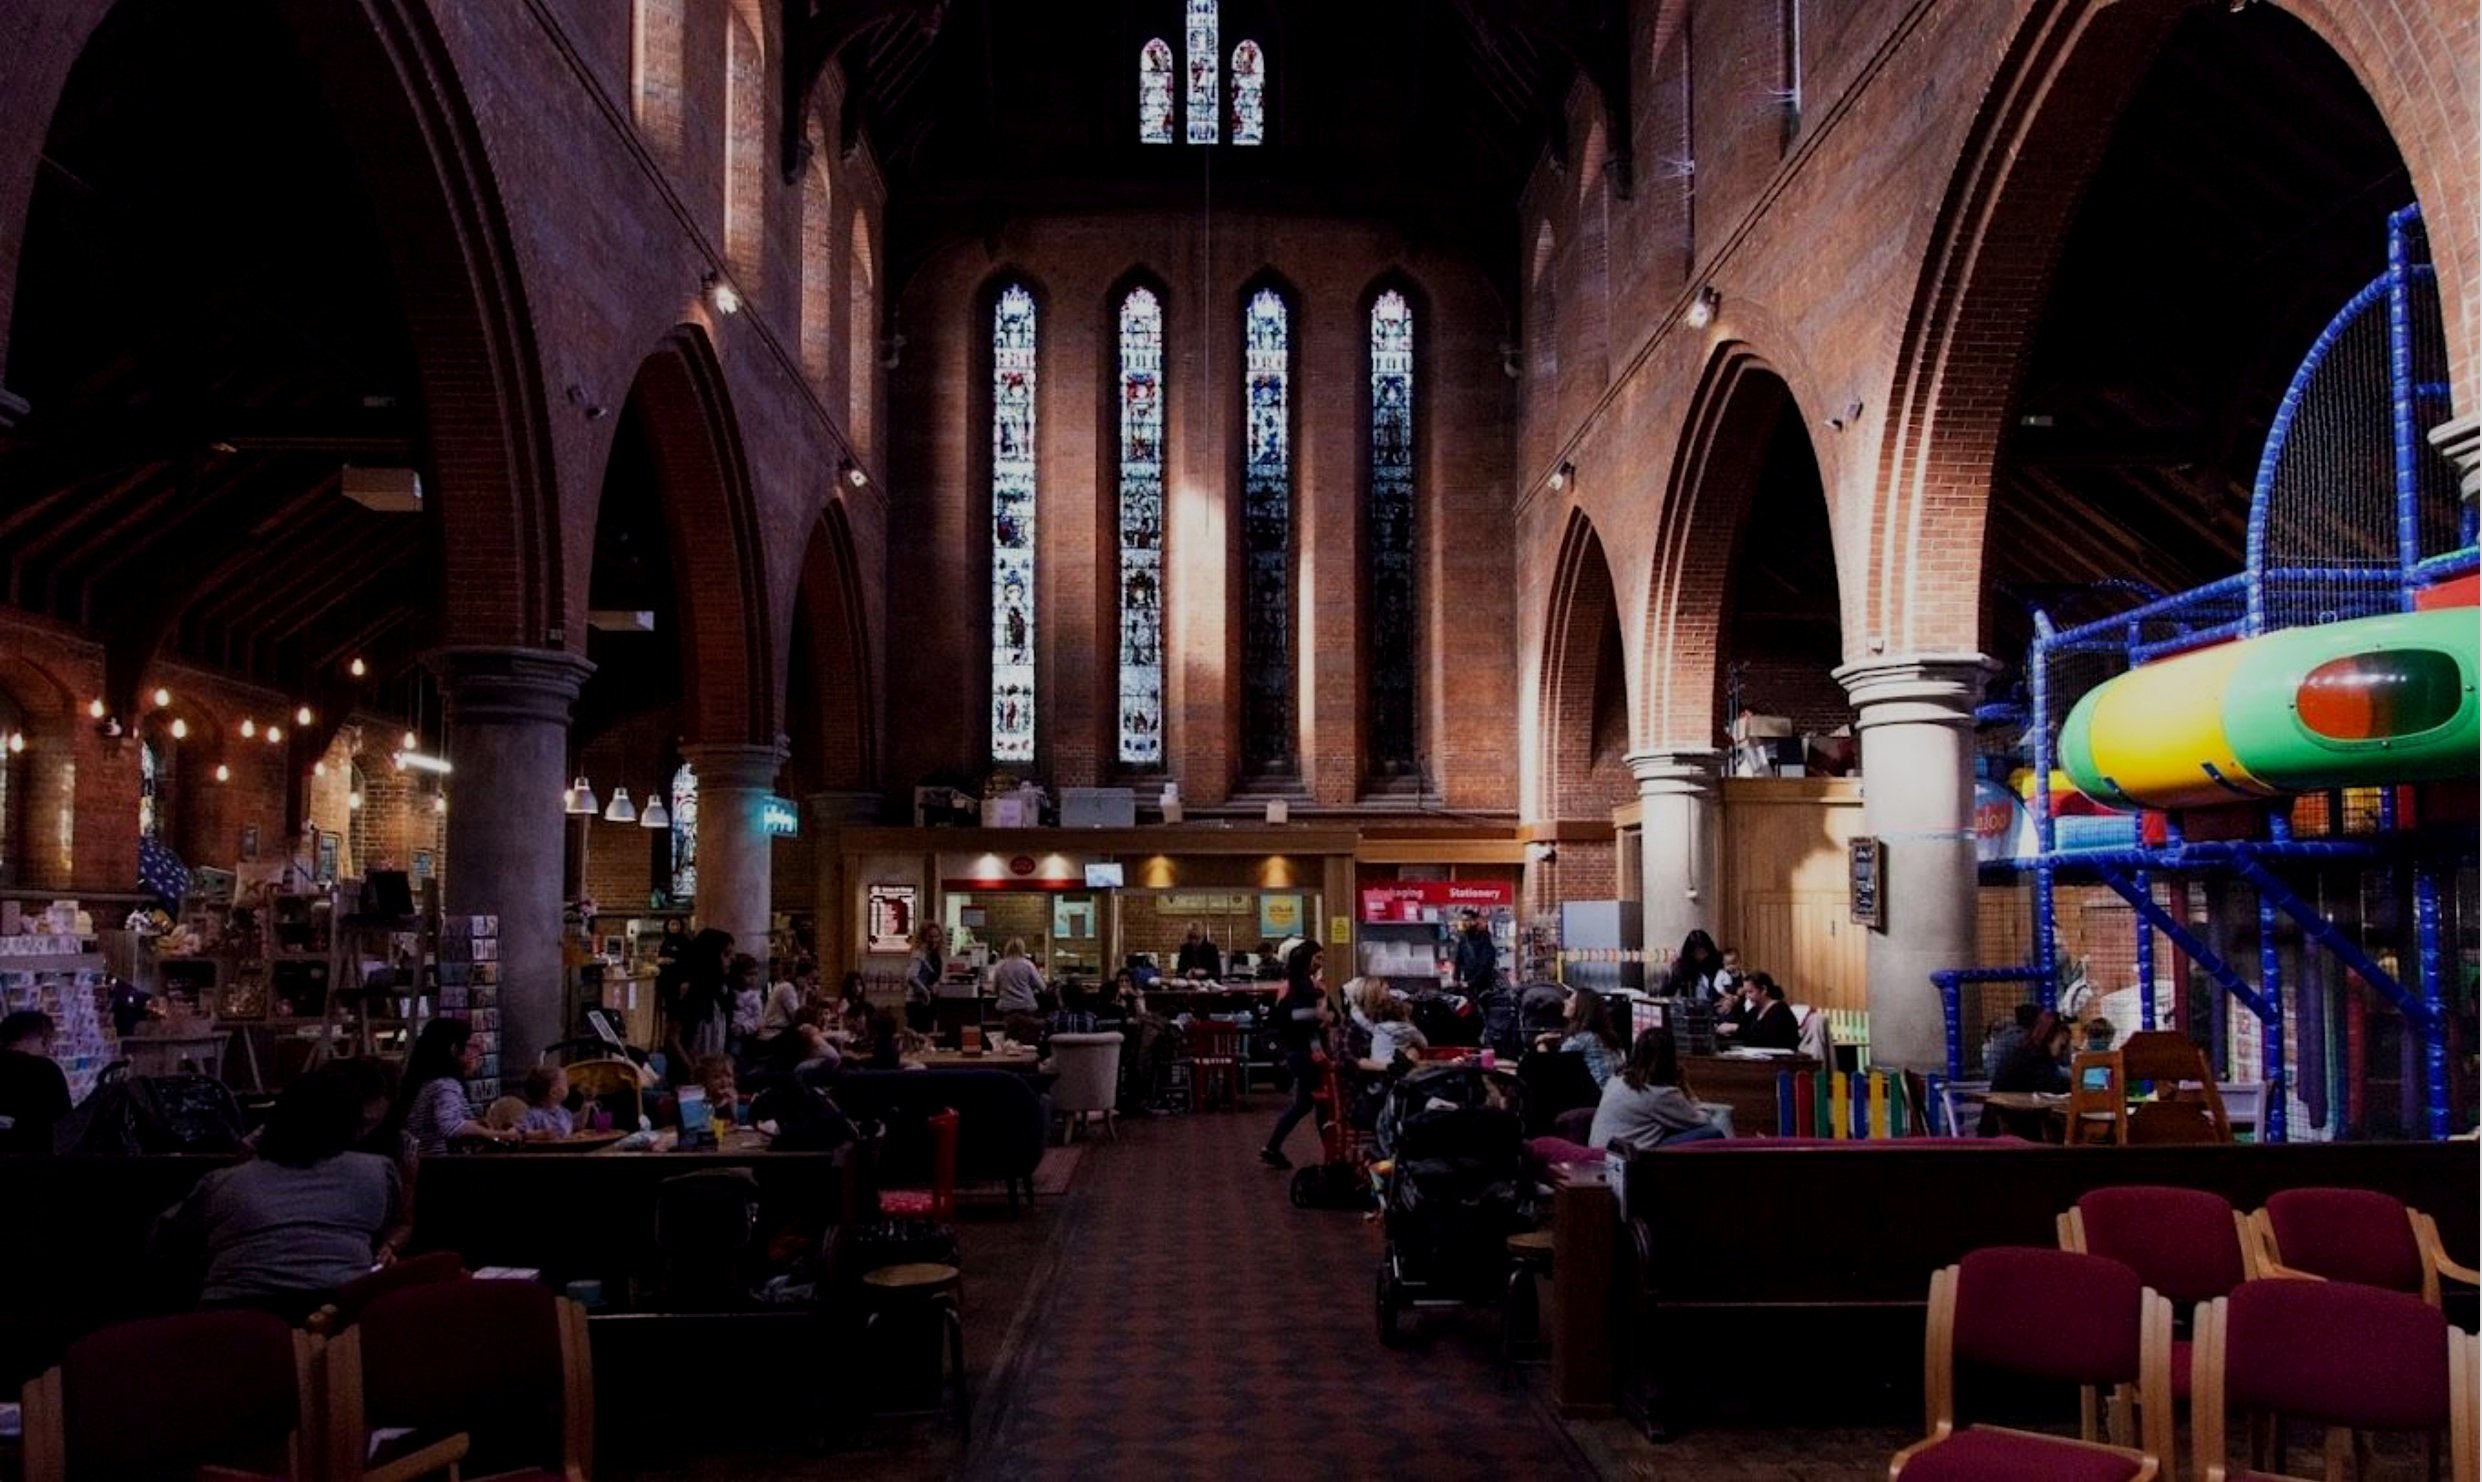
Churches open to reimagining how their spaces can be utilized may discover new ways to serve their communities, build stronger connections, and contribute to the financial sustainability of their facilities.

Tax-Exemption Issues For Mass. Churches and Religious Organizations
As churches explore ways to use their buildings more fully, they also need to consider any potential issues that might affect their tax-exempt status.
Religion is prominently woven into Boston's streets with Protestant and Catholic church facades gracing almost every major block. Christian organizations still hold over 300 properties in Boston—about 250 used primarily for worship.
Yet, studies reveal a notable trend: on average, churches in North American cities such as Boston use their buildings only 15% of the week.1 However, since not all areas of the building are occupied at once, the actual space in use per week can drop to below 1% of the total square footage, leaving large portions of the building—such as halls, classrooms, and sanctuaries—empty outside of Sunday services.
Even though religious organizations own only about 4% of Boston’s total land,2 this still represents a substantial share of real estate that lies underutilized daily. This discrepancy is particularly striking in a city where physical space is at a premium. Depending on the neighborhood, office rentals range from $35 to $70 per square foot,3 and retail spaces command around $25 to $80 per square foot a year.4 With social service agencies, nonprofits, small businesses, and individuals all struggling to find affordable facilities, houses of worship possess an extraordinary, yet often untapped, resource: their properties.
The question is, what will churches do with this opportunity?
This study focused on hearing the experiences of leaders involved in the administration and management of property for 10 churches in Greater Boston. These articles expound on themes these leaders discussed and delve into the significant challenges, opportunities, questions, and decisions that Boston's churches face as they navigate the complex terrain of property utilization and management.
The vision I hope to catalyze through this series on Exploring Church Spaces is one where churches strategically leverage and steward their owned properties to contribute to the vitality of their local communities, fulfill their missions, and be indispensable places for generations to come.
- Eric Bahme, “4 Ways to Fill Your Church Building Every Day,” PushPay (blog), accessed October 1, 2024, pushpay.com/blog/4-ways-fill-church-building-every-day.↩︎
- Boston Municipal Research Bureau, “Government Owns 79% of Boston’s Exempt Area,” October 2017, https://bmrb.org/wp-content/uploads/2017/10/BUExempt1017.pdf; “Boston’s Tax-Exempt Property Snapshot,” July 18, 2018, https://www.bmrb.org/bostons-tax-exempt-property-snapshot/. ↩︎
- Statista Research Department, “Rental Rates for Office Space in Boston in the 2nd Quarter of 2023, by District,” Statista, November 3, 2023, https://www.statista.com/statistics/1272212/office-space-rental-rates-by-district-boston/. See also “Boston Market in Minutes Office Q3 2024,” Savills, accessed October 10, 2024, https://pdf.euro.savills.co.uk/usa/market-reports/boston-mim-office-q3-2024.pdf.↩︎
- “Boston Retail Space for Lease,” Loopnet, accessed October 1, 2024, https://www.loopnet.com/search/retail-space/boston-ma/for-lease/. See also “Boston Area Retail Market Report for Q2 2024,” Associated Brokerage Group, accessed October 10, 2024, https://abgrealty.com/retail-market-report/.↩︎

Four Ways Churches Use Their Space for Economic Empowerment
Some churches have successfully transformed their properties into dynamic community centers offering various services, from food pantries and after-school programs to cultural events and neighborhood meetings.

Managing church property involves balancing the community’s needs with the congregation’s values and long-term sustainability. This guide explores how some churches in Boston walk that line.