

BLOG: APPLIED RESEARCH OF EMMANUEL GOSPEL CENTER

The Value and Relevance of Community Research
In-depth research helps us go below the surface.
Photo credit: Andrew Holzschuh via Lightstock
The Value and Relevance of Community Research
By Rudy Mitchell, Senior Researcher
Why research our communities when we can simply talk to people or make casual observations?
In-depth research helps us go below the surface. There we discover the root causes of problems, hidden needs, or little-known assets and resources.
Research provides a broader understanding of the various trends or forces impacting our communities. With this greater awareness, Christians can more effectively minister in their communities or start new ministries.
Community research lays a foundation for community transformation and effective witness.
This presentation is part of the larger series, Community Research and the Church. For earlier segments, click here.


![Gender Based Violence & the Church [Resources]](https://images.squarespace-cdn.com/content/v1/57ff1c7ae58c62d6f84ba841/1525202179581-91N8RV6OP4ASQAHLX1OD/black-and-white-black-and-white-depressed-568025.jpg)


The Nature of Community Research
What is community research?
Photo credit: Sam Ramsey via Lightstock
The Nature of Community Research
by Rudy Mitchell, Senior Researcher
Communities are complex social systems made up of people interacting with each other within a local area. The geographical context can be as small as a neighborhood or as large as an entire region.
As we learned in the first part of the Community Research and the Church series, community research includes various tools to learn more about your neighbors and community.
Community research is the systematic, careful study of a group of people who have common ties and social interactions, as well as the local area in which they live or interact.
How does this square with our Christian faith? God’s revelation provides a perspective on the world that informs our study of communities and culture. This biblical and theological research combined with community research helps us apply biblical principles and develop practical ministries in the church and community.
This presentation is part of the larger series, Community Research and the Church. In the next segment, we explore the value and relevance of community research.

Ministry With Eyes Wide Open: The Varied Lenses of Community Research
From community-based participatory research to social-network analysis, there are various ways Christians can learn more about the communities they serve.
Photo credit: Hamilton Photography via Lightstock
Ministry with Eyes Wide Open: The Varied Lenses of Community Research
by Rudy Mitchell, Senior Researcher
Are you seeing all that can be observed about your community?
From community-based participatory research to social-network analysis, there are various ways Christians can learn more about the communities they serve.
In this presentation, we explore several approaches to community research:
Spiritual and religious assessment
Historical-research approach
Demographic approach with mapping
Community-based participatory research
Assets-based approach
Needs-assessment approach
Community-indicators approach
Leadership studies and stakeholder analysis
Case studies of organizations and best practices
Social-network approach
Systems-analysis approach
A number of these approaches can be used as part of an overall community-building or community-development process that leads to community transformation.
This presentation is part of the larger series, Community Research and the Church. In the next segment, we explore the nature of community research and how it relates to biblical research and Christian ministry.
Community Research and the Church
A Christian church or ministry functions in the context of a particular community. To effectively minister in that community, it’s important to understand it.
Photo Credit: Athena Grace via Lightstock
Community Research and the Church
by Rudy Mitchell, Senior Researcher
A Christian church or ministry functions in the context of a particular community. To effectively minister in that community, it’s important to understand it.
There are various ways Christians can learn more about the communities they serve. Community research provides us with the tools to go below surface observations. It lays a foundation for community transformation and effective witness.
In this series, we explore several facets of community research: different approaches, its nature, and its value and relevance to the church.
Illustrated Guide for Researching Your Community
From population trends to social needs, this illustrated guide lists the factors to consider when learning more about a local neighborhood or community.
Photo credit: Boston Heath via Lightstock
by Rudy Mitchell, Senior Researcher
Click here for a template of a community research guide.
Community or Neighborhood Name:
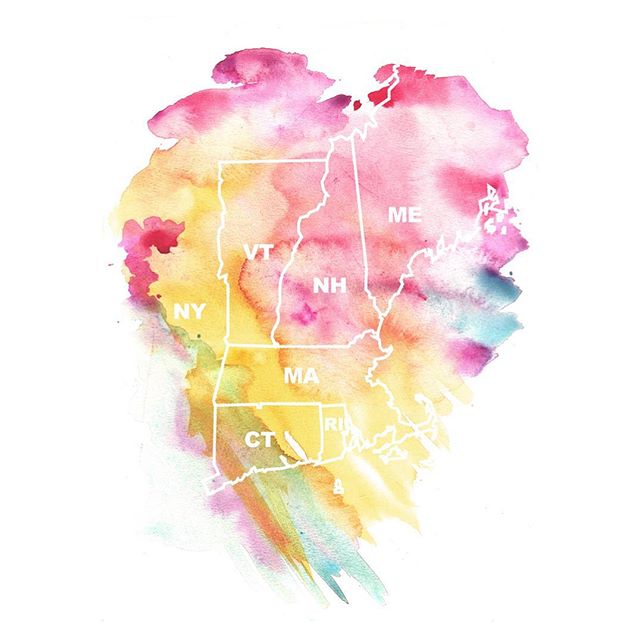
Community geography
Clearly identify the boundaries of your community (geographical, political).
Identify the U.S. Census tracts of the community (unless you are covering a large area) or identify other defined areas used in population or demographic surveys.
Describe the main geographical features of the neighborhood or community. Describe any other basic defining characteristics or features. What key features (rivers, hills, waterfront, railroad, etc.) influence or define the nature and boundaries of the community?
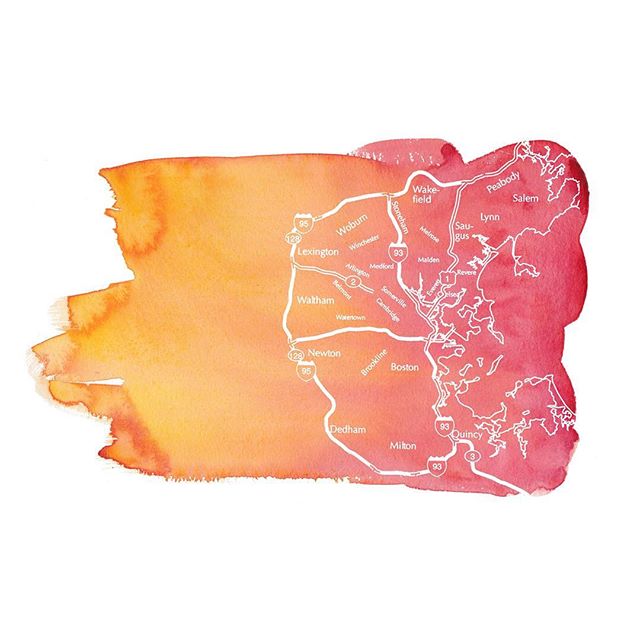
Create or obtain a detailed map of the neighborhood or community. Add boundaries and use the base map to add other items of interest such as churches, schools, social service organizations, landmarks, cultural organizations, neighborhood associations, recreational facilities, and other resource assets. Separate maps can be created for different types of resources or institutions. You can also do this using layers in digital maps. You can use Google My Maps to create and share online maps. See google.com/mymaps. Another online option is to create a map in Harvard World Map, worldmap.harvard.edu, or Open Street Map, openstreetmap.org.

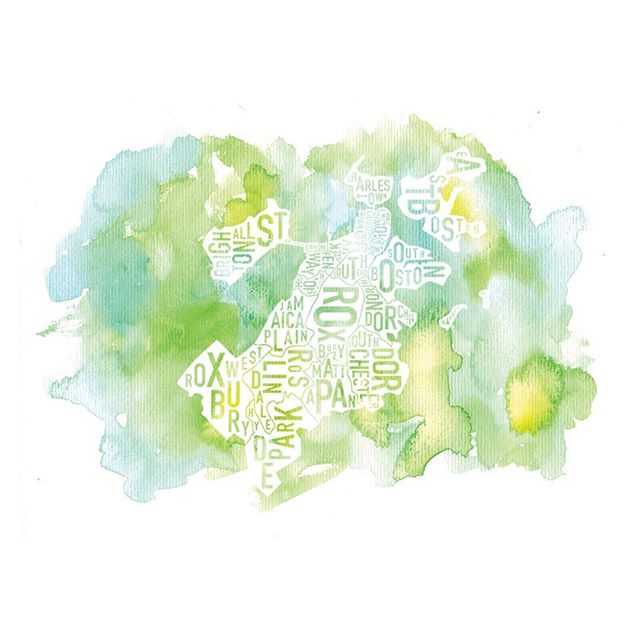
Grove Hall Boundaries and Census Tracts

Map of neighborhood churches
Examples of maps in a community study.


Map of Organizations and Programs in a Neighborhood

Key to map
Maps of schools, churches, and other institutions can be created, or these can be combined using symbols into one map.

Hawthorne Grove, the Marshall P. Wilder Estate
Community history
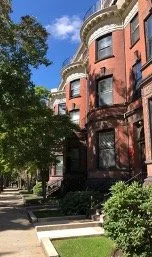
Research the community’s history using primary and secondary sources, as well as oral history interviews. Aspects of community history may include biographical information on significant people; the history of the built environment; the history of religious and cultural organizations; economic and political history; and the history of ethnic, racial, and social changes. The history can be presented in narrative form supplemented with maps, charts, and visual illustrations.

Old Blake House, Edward Everett Square, Dorchester
Overall population and population trends
What is the current total population of the community or neighborhood?
What overall population trends have occurred in the last several decades? Include earlier data if available. Explore possible reasons related to the changes and possible future trends.
| Decade | 1990 | 2000 | 2010 | Latest |
|---|---|---|---|---|
| Total population | ||||
| % change from previous decade |
[The formula for the % change is (B-A) /A x 100. Say the 1980 population (A) is 1,000 and the 1990 population (B) is 800. To find the percentage change from 1980 (A) to 1990 (B), begin on the calculator with B (800) and subtract A (1,000), then divide that by A (1,000) and multiply it by 100. You should get -20. You can add the percentage sign (%) to -20. The percentage change from A (1,000) to B (800) is -20%.]

Example of a line graph showing the population trend for a neighborhood study.
Ethnic and racial composition and trends of the community
Fill out this table for the major ethnic and racial groups in the community. (You may expand the table if you would like to include more groups, or you may combine smaller groups into an “Other” category.) Separate tables can be created for each census tract or for specific nationalities within the Hispanic group. Graphs and maps may also be used to visualize trends and changes. If the community has other nationalities and ethnic groups not listed in your table, you can list and describe them separately. Describe any intercultural or inter-racial tensions that exist. Summarize your observations and analysis of population trends.
| Name of group (ethnic group, racial group etc.) | 2000 | 2010 | Latest | pop. of group | % of total pop. | pop. of group | % of total pop. | pop. of group | % of total pop. |
|---|---|---|---|---|---|---|
| 1. | ||||||
| 2. | ||||||
| 3. | ||||||
| 4. | ||||||
| 5. | ||||||
| Total pop. | 100% | 100% | 100% | |||
The formula to find the percent is A/total x 100. Say 2,000 people (total) are in your community, and 250 (A) are Hispanic. Put 250 (A) on your calculator, divide by 2,000 (total), and multiply by 100. You should get 12.5. You can add the percent sign to your answer because you multiplied by 100. 250/2,000 x 100 = 12.5% of the people in your community are Hispanic. (Make sure your percentages total 100%.)
From this table, how has the ethnic and racial composition of the community changed in the last few decades? Summarize your observations and analysis of population trends.
Describe any intercultural or inter-racial tensions that exist.
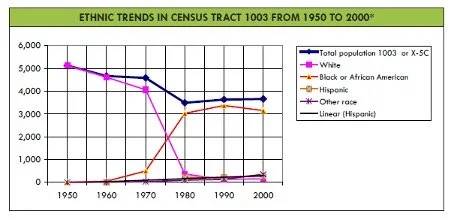
Example of a graph showing racial trends in a neighborhood.
Languages spoken and linguistic isolation
What languages are spoken in the community? Provide numbers per language.
What number and percentage of the population are linguistically isolated? ( A household is linguistically isolated if all members 14 years and older speak a non-English language and they speak English less than “very well.”) Of those who are linguistically isolated, what percentages speak various languages other than English? What percentage of the population over 5 years speaks English less than “very well?”

What are the age characteristics of the community’s population?
Complete the following table to reveal any important differences between the age profile of the church, community, and nation. Use your personal estimate or ask your pastor for the church data. (Figure the percentages and make sure they add up to 100.) Do the percentages differ significantly between the church, the community, and the nation?
| Age category | Your church | Community | Nation | Number | % | Number | % | Number | % |
|---|---|---|---|---|---|---|
| 0-4 years | ||||||
| 5-9 years | ||||||
| 10-19 years | ||||||
| 20-34 years | ||||||
| 35-64 years | ||||||
| 65+ years | ||||||
| Total | 100% | 100% | 100% | |||
The formula to find the percent is A/total x 100. Say there are 200 people (total) in your church, and 25 (A) are youth. Put 25 (A) on your calculator, divide by 200 (total), and multiply by 100. You should get 12.5. You can add the percent sign to your answer because you multiplied by 100. 25/200 x 100 = 12.5% of your church are youth.
What is the current median age of the population? Compare this with the median age of the nation, state, and larger city, or metropolitan area. Compare median age differences between different races in the community (and between the Hispanic and non-Hispanic populations).
Observe more specific characteristics of the teenage and young adult populations, such as the racial and ethnic composition. Break down the age groups by single years.
Which generations are represented in significant numbers in your church? Is one generation dominant?
Baby Boomers, born 1946-1964
Generation X, born 1965-1980
Millennials, born 1981-1996
Generation Z, born 1997-2012


Examples of graphs showing age profiles and comparisons of a neighborhood.
Family Characteristics and Marital Status
What is the average household size in the community? What is the average household size in the individual census tracts or subsections of the community? Observe any variations and also compare with the metropolitan area, state, and nation.
What are the numbers and percentages of the population (over 15 years) in your community who are:
| Marital status | Number | % |
|---|---|---|
| Now married (except separated) | ||
| Single (never married) | ||
| Separated | ||
| Divorced | ||
| Widowed | ||
| Total population (over 15 years) | 100% |
Source:
What percentage of families consist of (Compare to total population: A/total x 100 = %)
Married couples with children (under 18 years)? %
Married couples without children (under 18 years)? %
Households
What is the total number of households?
What percentage of households are family households?
What percentage of households are non-family households?
How do these percentages compare with the state and national percentages?
How many family households have children under 18 years?
How many of these family households with children under 18 are female-headed with no male spouse present?
How many of these family households with children under 18 are male-headed with no female spouse present?
What number and percentage of family households with children under 18 are single-parent households?
Number:
%:
What percentage of children under 18 years living in households, lived with
Grandparents:
Other relatives:
Non-relatives:
Economics and Income
Poverty
What percentage of the population is living below the poverty level?
What percentage of youth age 18 and under are living below the poverty level?
What percentage of youth ages 12-17 are living below the poverty level?
Families: What is the total number of families? What is the number of families living below the poverty level? What percentage of families live below the poverty level?
Comparisons: How do the percentages above compare with the city, state, and national percentages? Do some parts of the study area have higher rates of poverty than others?
Income
What is the median family income in this community?
What is the mean (average) family income in this community?
| 2000 | 2010 | Latest | |
|---|---|---|---|
| Community | |||
| Metropolitan area | |||
| State | |||
| Nation |
Trends
Has the general income of the community changed significantly relative to wider trends? (Middle income to lower income, or gentrification, etc.)
Employment
Major employers or types of employers in the community?
What is the present rate of unemployment? %
Have there been any changes in the type of employment, location of employment, or unemployment rates?
Education
Highest level of education: What percentage of all persons over 25 years old have
Less than high school?
High school?
Bachelor’s degree?
Master’s degree or higher
How do these percentages compare with the national and state percentages?

Example of a graph comparing educational achievements.
What is the current event drop-out rate for any high schools in the community?
Research the elementary and secondary educational institutions in the community.
List and describe each school. Provide any statistical data available.
List any postsecondary educational institutions and their enrollment.

Jeremiah Burke High School
Housing
What are the major housing types in the community based on your observation? (High-rise apartments or public housing; single-family detached houses, rowhouses, duplexes, triple-deckers, etc.)
What percentage of the housing units are owner-occupied? % (Compare to total)
What percentage of the housing units are low-income or affordable? % (Compare to total)
What is the median housing value for the community? For the nation?
Is the housing value increasing, decreasing, or stable?
What are the current typical monthly rental costs for a
Studio:
One-bedroom:
Two-bedroom:
Or more bedrooms
What housing needs and problems does the community have?
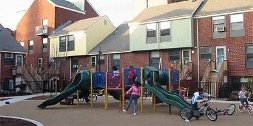

Recreation
List any important recreational facilities and activities in the community:
Source:
Community events
List major community events that occur annually or regularly:
Source:
Organizations
List any major community organizations, neighborhood associations, clubs, social, political, or educational groups:
Source:
Media
How are events in the community publicized?
Is there a community newspaper?
Source:
Social Needs
List any important Social Service Agencies and their services:
Source:
List three social needs that are not being effectively met by these groups.
Source:
What are the major crime concerns in the neighborhood?
Source:
Click here for a template of a community research guide.

Guide for Researching Your Community
From population trends to social needs, this guide lists the factors to consider when learning more about a local neighborhood or community.
Photo credit: JYount Photo via Lightstock
by Rudy Mitchell, Senior Researcher
Click here for an illustrated guide to researching your community.
Community or Neighborhood name:
Community geography
Clearly identify the boundaries of your community (geographical, political).
Identify the U.S. Census tracts of the community (unless you are covering a large area) or identify other defined areas used in population or demographic surveys.
Describe the main geographical features of the neighborhood or community. Describe any other basic defining characteristics or features. What key features (rivers, hills, waterfront, railroad, etc.) influence or define the nature and boundaries of the community?
Create or obtain a detailed map of the neighborhood or community. Add boundaries and use the base map to add other items of interest such as churches, schools, social service organizations, landmarks, cultural organizations, neighborhood associations, recreational facilities, and other resource assets. Separate maps can be created for different types of resources or institutions. You can also do this using layers in digital maps. You can use Google My Maps to create and share online maps. See google.com/mymaps. Another online option is to create a map in Harvard World Map, worldmap.harvard.edu, or Open Street Map, openstreetmap.org.
Community history
Research the community’s history using primary and secondary sources, as well as oral history interviews. Aspects of community history may include biographical information on significant people; the history of the built environment; the history of religious and cultural organizations; economic and political history; and the history of ethnic, racial, and social changes. The history can be presented in narrative form supplemented with maps, charts, and visual illustrations.
Overall population and population trends
What is the current total population of the community or neighborhood?
What overall population trends have occurred in the last several decades? Include earlier data if available. Explore possible reasons related to the changes and possible future trends.
| Decade | 1990 | 2000 | 2010 | Latest |
|---|---|---|---|---|
| Total population | ||||
| % change from previous decade |
[The formula to find the % change is (B-A) /A x 100. Say the 1980 population (A) is 1,000 and the 1990 population (B) is 800. To find the percentage change from 1980 (A) to 1990 (B), begin on the calculator with B (800) and subtract A (1,000), then divide that by A (1,000) and multiply by 100. You should get -20. You can add the percentage (%) sign to -20. The percentage change from A (1,000) to B (800) is -20%.]
Ethnic and Racial composition and trends of the community
Fill out this table for the major ethnic and racial groups in the community. (You may expand the table if you would like to include more groups, or you may combine smaller groups into an “Other” category.) Separate tables can be created for each census tract or for specific nationalities within the Hispanic group. Graphs and maps may also be used to visualize trends and changes. If the community has other nationalities and ethnic groups not listed in your table, you can list and describe them separately. Describe any intercultural or inter-racial tensions that exist. Summarize your observations and analysis of population trends.
| Name of group (ethnic group, racial group etc.) | 2000 | 2010 | Latest | pop. of group | % of total pop. | pop. of group | % of total pop. | pop. of group | % of total pop. |
|---|---|---|---|---|---|---|
| 1. | ||||||
| 2. | ||||||
| 3. | ||||||
| 4. | ||||||
| 5. | ||||||
| Total pop. | 100% | 100% | 100% | |||
The formula to find the percent is A/total x 100. Say there are 2,000 people (total) in your community, and 250 (A) are Hispanic. Put 250 (A) on your calculator, divide by 2,000 (total), and multiply by 100. You should get 12.5. You can add the percentage (%) sign to your answer because you multiplied by 100. 250/2,000 x 100 = 12.5% of the people in your community are Hispanic. (Make sure your percentages total 100%.)
From this table, how has the ethnic and racial composition of the community changed in the last few decades? Summarize your observations and analysis of population trends.
Describe any intercultural or inter-racial tensions that exist.
Languages spoken and linguistic isolation
What languages are spoken in the community? Provide numbers per language.
What number and percentage of the population are linguistically isolated? ( A household is linguistically isolated if all members 14 years and older speak a non-English language and they speak English less than “very well.”) Of those who are linguistically isolated, what percentages speak various languages other than English? What percentage of the population over 5 years speaks English less than “very well?”
What are the age characteristics of the community’s population?
Complete the following table to reveal any important differences between the age profile of the church, community, and nation. Use your personal estimate or ask your pastor for the church data. (Figure the percentages and make sure they add up to 100.) Do the percentages differ significantly between the church, the community, and the nation?
| Age category | Your church | Community | Nation | Number | % | Number | % | Number | % |
|---|---|---|---|---|---|---|
| 0-4 years | ||||||
| 5-9 years | ||||||
| 10-19 years | ||||||
| 20-34 years | ||||||
| 35-64 years | ||||||
| 65+ years | ||||||
| Total | 100% | 100% | 100% | |||
The formula to find the percent is A/total x 100. Say there are 200 people (total) in your church, and 25 (A) are youth. Put 25 (A) on your calculator, divide by 200 (total), and multiply by 100. You should get 12.5. You can add the percentage (%) sign to your answer because you multiplied by 100. 25/200 x 100 = 12.5% of your church is youth.
What is the current median age of the population? Compare this with the median age of the nation, state, and larger city, or metropolitan area. Compare median age differences between different races in the community (and between the Hispanic and non-Hispanic populations).
Observe more specific characteristics of the teenage and young adult populations, such as the racial and ethnic composition. Break down the age groups by single years.
Which generations are represented in significant numbers in your church? Is one generation dominant?
Baby Boomers, born 1946-1964
Generation X, born 1965-1980
Millennials, born 1981-1996
Generation Z, born 1997-2012
Family Characteristics and Marital Status
What is the average household size in the community? What is the average household size in the individual census tracts or subsections of the community? Observe any variations and also compare with the metropolitan area, state, and nation.
What are the numbers and percentages of the population (over 15 years) in your community who are:
| Marital status | Number | % |
|---|---|---|
| Now married (except separated) | ||
| Single (never married) | ||
| Separated | ||
| Divorced | ||
| Widowed | ||
| Total population (over 15 years) | 100% |
Source:
What percentage of families consist of (Compare to total population: A/total x 100 = %)
Married couples with children (under 18 years)? %
Married couples without children (under 18 years)? %
Households
What is the total number of households?
What percentage of households are family households?
What percentage of households are non-family households?
How do these percentages compare with the state and national percentages?
How many family households have children under 18 years?
How many of these family households with children under 18 are female-headed with no male spouse present?
How many of these family households with children under 18 are male-headed with no female spouse present?
What number and percentage of family households with children under 18 are single-parent households?
Number:
%:
What percentage of children under 18 years living in households, lived with
Grandparents:
Other relatives:
Non-relatives:
Economics and income
Poverty
What percentage of the population is living below the poverty level?
What percentage of youth age 18 and under are living below the poverty level?
What percentage of youth ages 12-17 are living below the poverty level?
Families: What is the total number of families? What is the number of families living below the poverty level? What percentage of families live below the poverty level?
Comparisons: How do the percentages above compare with the city, state, and national percentages? Do some parts of the study area have higher rates of poverty than others?
Income
What is the median family income in this community?
What is the mean (average) family income in this community?
| 2000 | 2010 | Latest | |
|---|---|---|---|
| Community | |||
| Metropolitan area | |||
| State | |||
| Nation |
Trends
Has the general income of the community changed significantly relative to wider trends? (Middle income to lower income, or gentrification, etc.)
Employment
Major employers or types of employers in the community?
What is the present rate of unemployment? %
Have there been any changes in the type of employment, location of employment, or unemployment rates?
Education
Highest level of education: What percentage of all persons over 25 years old have
Less than high school?
High school?
Bachelor’s degree?
Master’s degree or higher
How do these percentages compare with the national and state percentages?
What is the current event drop-out rate for any high schools in the community?
Research the elementary and secondary educational institutions in the community.
List and describe each school. Provide any statistical data available.
List any postsecondary educational institutions and their enrollment.
Housing
What are the major housing types in the community based on your observation? (High-rise apartments or public housing; single-family detached houses, rowhouses, duplexes, triple-deckers, etc.)
What percentage of the housing units are owner-occupied? % (Compare to total)
What percentage of the housing units are low-income or affordable? % (Compare to total)
What is the median housing value for the community? For the nation?
Is the housing value increasing, decreasing, or stable?
What are the current typical monthly rental costs for a
Studio:
One-bedroom:
Two-bedroom:
Or more bedrooms
What housing needs and problems does the community have?
Recreation
List any important recreational facilities and activities in the community:
Source:
Community events
List major community events that occur annually or regularly:
Source:
Organizations
List any major community organizations, neighborhood associations, clubs, social, political, or educational groups:
Source:
Media
How are events in the community publicized?
Is there a community newspaper?
Source:
Social Needs
List any important Social Service Agencies and their services:
Source:
List three social needs that are not being effectively met by these groups:
Source:
What are the major crime concerns in the neighborhood?
Source:
Click here for an illustrated guide to researching your community.
RESEARCHING YOUR CITY FOR MINISTRY IMPACT
Resource List used by Nika Elugardo for Movement Day 2016.
Resources for Research
PRESENTER’S WEB CONNECTIONS
· Berlin – Gemeinsam für Berlin (Together for Berlin) http://www.gfberlin.de/startseite
· Boston – Emmanuel Gospel Center (EGC) – http://www.egc.org/
· South Africa –
o Jewels of Hope http://jewelsofhope.org/
o Johannesburg Housing Company – http://www.jhc.co.za/
EXAMPLES OF RESEARCH FROM EMMANUEL GOSPEL CENTER (EGC)
Note: EGC is engaged in a website makeover. We are working to migrate files from our old site to the new one as quickly as we can. Some of these resources may not be available right away.
· New England’s Book of Acts. Stories of how God is growing the churches among many people groups and ethnic groups in Greater Boston. https://www.egc.org/blog-2/new-englands-book-of-acts.
· What is the Quiet Revival? an overview:
What is the Quiet Revival? Fifty years ago, a church planting movement quietly took root in Boston. Since then, the number of churches within the city limits of Boston has nearly doubled.
http://www.egc.org/blog/2016/10/13/understanding-bostons-quiet-revival
· Youth Violence System Project (YVSP) – http://www.gettingtotheroots.org/
o YVSP Neighborhood Studies — http://www.gettingtotheroots.org/community
o YVSP overview — Khary Bridgewater, et al, “A Community-Based Systems Learning Approach to Understanding Youth Violence in Boston,” Progress in Community Health Partnership: Research, Education, and Action) http://www.gettingtotheroots.org/aes/sites/default/files/yvsp_sprev_article1.pdf
· Boston Church Directory — print editions 1989 to 2001; online condensed edition at http://egcboston.force.com/bcd
Other EGC studies (some available in print, all will be available online in the near future at egc.org)
· The Unsolved Leadership Challenge (2014; church planting and women in leadership)
· Christianity in Boston (1993; discovery of Quiet Revival)
· Educating Urban Christians in the 21st Century (1998; needs assessment study)
· Youth Ministry in Boston (1995; needs assessment survey)
· Studying Urban Communities (1994, and updates; questionnaire and study guide)
SOME EXCELLENT CITY RESEARCH TOOLS & ORGANIZATIONS
Center for the Study of Global Christianity: (Gordon-Conwell Theological Seminary) does research to maintain the World Christian Database, which has data on over 5,000 cities. It also is the repository for research collected by the World Evangelisation Research Center in Nairobi, Kenya. Other resources include the World Christian Encyclopedia and the Atlas of Global Christianity. Director Todd Johnson. http://www.gordonconwell.edu/ockenga/research/index.cfm
Community Tool Box: a major, free online set of resources for anyone seeking to improve communities or foster social change. Among the 46 areas covered in English, Spanish and Arabic are several related to research: “Assessing Community Needs and Resources” (Ch. 3), Evaluation Research (Chs. 36-39), and “Analyzing Community Problems and Solutions” (Ch. 17). Associated with the Univ. of Kansas. http://ctb.ku.edu/en/table-of-contents
Global Research, International Mission Board (IMB) & Global Research Information Center http://public.imb.org/globalresearch/Pages/default.aspx
Lausanne International Researchers Network https://www.facebook.com/LausanneInternationalResearchersNetwork/
Minneapolis - St. Paul City View Reports: by John A. Mayer; religious demographics of the twin cities. http://cityvisiontc.org/?page_id=535
Movement of African National Initiatives (MANI): Continental Coordinator, Reuben Ezemadu; research focused on discovering unreached groups. http://maniafrica.com/research/
OC Research (Department of One Challenge International) http://www.ocresearch.info
Operation World, Patrick Johnstone; prayer oriented research on all countries (7th ed.) http://www.operationworld.org/
BOOKS & ARTICLES ON URBAN CHURCH & COMMUNITY RESEARCH
Conn, Harvie M., and Manuel Ortiz. Urban Ministry: The Kingdom, The City, and the People of God. Downers Grove, Ill.: InterVarsity Press, 2001. See also Section 1 in Planting and Growing Urban Churches: From Dream to Reality, edited by Harvie M. Conn. Grand Rapids, MI: Baker Books, 1997.
Conn, Harvie M. Urban Church Research: Methods and Models: Collected Readings. Philadelphia: Westminster Theological Seminary, 1985.
Dudley, Carl S. Community Ministry: New Challenges, Proven Steps to Faith Based Initiatives. Herndon, Virginia: Alban Institute, 2002. See especially part I.
Eisland, Nancy L. and R. Stephen Warner. “Ecology: Seeing the Congregation in Context.” In Studying Congregations: A New Handbook, edited by Nancy T. Ammerman, Jackson W. Carroll, Carl S. Dudley, and William McKinney. Nashville: Abingdon Press, 1998.
Hadaway, C. Kirk. “Learning from Urban Church Research.” Urban Mission, January 1985, 33-44.
Lingenfelter, Judith. “Getting to Know Your New City.” In Discipling the City: A Comprehensive Approach to Urban Mission, 2nd edition, edited by Roger S. Greenway. Grand Rapids, Mich.: Baker Books, 1992.
Monsma, Timothy M. “Research: Matching Goals and Methods to Advance the Gospel.” In Discipling the City: A Comprehensive Approach to Urban Mission, 2nd edition, edited by Roger S. Greenway. Grand Rapids, Mich.: Baker Books, 1992.
Nussbaum, Stan. Breakthrough: Prayerful, Productive Field Research in Your Place of Ministry. 2nd edition. Colorado Springs, Colorado: GMI Research Services, 2011. Website for GMI Research - http://www.gmi.org/about-us/
Sider, Ronald J., Philip N. Olson, and Heidi Rolland Unruh. Churches That Make a Difference: Reaching Your Community with Good News and Good Works. Grand Rapids, Mich.: Baker Books, 2002. See chapter 12.
Taylor, Dick. “Discovering Your Neighborhood’s Needs.” Sojourners, June 1979, 22-24.
BOOKS & ARTICLES ON GENERAL RESEARCH METHODS
Bergold, Jarg, and Stefan Thomas. “Participatory Research Methods: A Methodological Approach in Motion.” Forum: Qualitative Social Research 13, no. 1 (January 2012): Article 30. http://www.qualitative-research.net/index.php/fqs/article/view/1801/3334 Special issue on participatory qualitative research and action research.
Beukes, Anni. “Know Your City: Community: Profiling of Informal Settlements.” IIED Briefing: Policy and Planning, June 2014, http://pubs.iied.org/pdfs/17244IIED.pdf. Importance and methods of gathering data on informal urban communities to work for community improvements.
Chevalier, Jacques, and Daniel J. Buckles. Handbook for Participatory Action Research, Planning and Evaluation. Ottawa, Canada: SAS2 Dialogue, 2013. Accessed 7 Oct. 2016. http://www.sas2.net/sites/default/files/sites/all/files/manager/Toolkit_En_March7_2013-S.pdf
Creswell, John W. Qualitative Inquiry and Research Design: Choosing Among Five Approaches. 3nd edition. Thousand Oaks, Calif.: Sage Publications, 2013. A practical book covering narrative research, phenomenology, grounded theory, ethnography, and case study approaches.
Denscombe, Martyn. The Good Research Guide for Small-Scale Social Research Projects. 5th edition. New York: McGraw-Hill / Open University Press, 2014. Contains helpful checklists, summaries, and text boxes highlighting the essentials of basic research methods.
Denzin, Norman K., and Yvonna S. Lincoln, editors. Handbook of Qualitative Research, 4th ed. Thousand Oaks, Calif.: Sage Publications, 2011. A standard text on the subject containing contributions from many leading international scholars.
DeWalt, Kathleen M., and Billie R. DeWalt. Participant Observation: A Guide for Fieldworkers. 2nd edition. Lanham, Maryland: AltaMira Press, 2010.
Emerson, Robert M., Rachel I. Fretz, and Linda L. Shaw. Writing Ethnographic Fieldnotes. 2nd edition. Chicago: University of Chicago Press, 2011. Very specific and well-illustrated guidance on collecting and writing up ethnographic field observations.
Krueger, Richard R., and Mary Anne Casey. Focus Groups: A Practical Guide for Applied Research. 5th edition. Thousand Oaks, Calif.: Sage Publications, 2015.
Leedy, Paul D., and Jeanne Ellis Ormrod. Practical Research: Planning and Design. 11th edition. Upper Saddle River, N. J.: Pearson, 2015. This book has gone through many editions and is useful in many subject areas of research.
Mack, Natasha, Cynthia Woodsong, Kathleen M. MacQueen, Greg Guest, and Emily Namey. Qualitative Research Methods: A Data Collector’s Field Guide. Research Triangle Park, N.C.: Family Health International, 2005. Available free online at: https://www.fhi360.org/resource/qualitative-research-methods-data-collectors-field-guide. This resource is designed for use in international settings and developing countries.
Morgan, David L. Focus Groups as Qualitative Research. 2nd ed. Thousand Oaks, Calif.: Sage Publications, 1996. See also Morgan and R.A. Krueger, The Focus Group Kit (6 volumes also published by Sage).
Saldana, Johnny. The Coding Manual for Qualitative Researchers. 3rd edition. Thousand Oaks, Calif.: Sage Publications, 2016. Coding is an important process in analyzing qualitative research data, and this book gives detailed examples and a great variety of methods used in coding.
Taylor, Steven J., Robert Bogdan, and Marjorie L. DeVault. Introduction to Qualitative Research Methods: A Guidebook and Resource. 4th edition. Hoboken, N.J.: John Wiley & Sons, 2016. Contains extensive material on participant observation, in-depth interviewing, and working with qualitative data.
Weiss, Robert S. Learning from Strangers: The Art and Method of Qualitative Interview Studies. New York: The Free Press, 1994. Includes examples and excerpts from interview transcripts with comments.
Yin, Robert K. Case Study Research: Design and Methods. 5th edition. Thousand Oaks, Calif.: Sage Publications, 2014. A standard work on case study research.
Keywords
- #ChurchToo
- 365 Campaign
- ARC Highlights
- ARC Services
- AbNet
- Abolition Network
- Action Guides
- Administration
- Adoption
- Aggressive Procedures
- Andrew Tsou
- Annual Report
- Anti-Gun
- Anti-racism education
- Applied Research
- Applied Research and Consulting
- Ayn DuVoisin
- Balance
- Battered Women
- Berlin
- Bianca Duemling
- Bias
- Biblical Leadership
- Biblical leadership
- Black Church
- Black Church Vitality Project
- Book Recommendations
- Book Reviews
- Book reviews
- Books
- Boston
- Boston 2030
- Boston Church Directory
- Boston Churches
- Boston Education Collaborative
- Boston General
- Boston Globe
- Boston History
- Boston Islamic Center
- Boston Neighborhoods
- Boston Public Schools
- Boston-Berlin
- Brainstorming
- Brazil
- Brazilian
- COVID-19
- CUME
- Cambodian
- Cambodian Church
- Cambridge


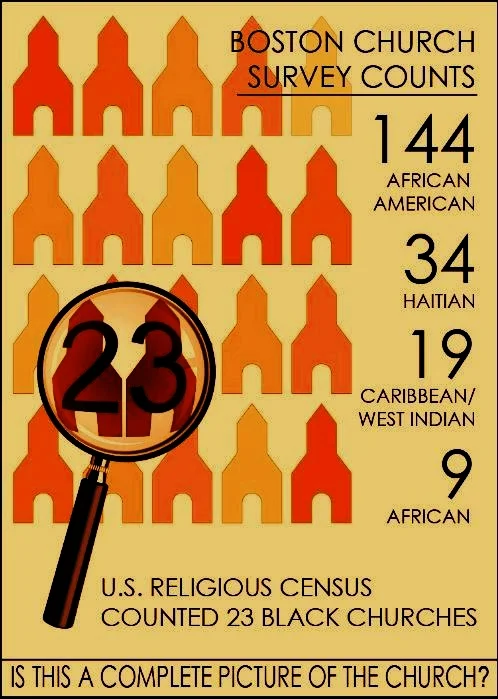
A frank look at the sources, accuracy, limitations, and weaknesses of some commonly used church statistics in Boston. As convenient and convincing as statistics are, they can be misunderstood, misapplied, and generate misinformation.