

BLOG: APPLIED RESEARCH OF EMMANUEL GOSPEL CENTER

The Value and Relevance of Community Research
In-depth research helps us go below the surface.
Photo credit: Andrew Holzschuh via Lightstock
The Value and Relevance of Community Research
By Rudy Mitchell, Senior Researcher
Why research our communities when we can simply talk to people or make casual observations?
In-depth research helps us go below the surface. There we discover the root causes of problems, hidden needs, or little-known assets and resources.
Research provides a broader understanding of the various trends or forces impacting our communities. With this greater awareness, Christians can more effectively minister in their communities or start new ministries.
Community research lays a foundation for community transformation and effective witness.
This presentation is part of the larger series, Community Research and the Church. For earlier segments, click here.


![Gender Based Violence & the Church [Resources]](https://images.squarespace-cdn.com/content/v1/57ff1c7ae58c62d6f84ba841/1525202179581-91N8RV6OP4ASQAHLX1OD/black-and-white-black-and-white-depressed-568025.jpg)


The Nature of Community Research
What is community research?
Photo credit: Sam Ramsey via Lightstock
The Nature of Community Research
By Rudy Mitchell, Senior Researcher
Communities are complex social systems made up of people interacting with each other within a local area. The geographical context can be as small as a neighborhood or as large as an entire region.
As we learned in the first part of the Community Research and the Church series, community research includes various tools to learn more about your neighbors and community.
Community research is the systematic, careful study of a group of people who have common ties and social interactions, as well as the local area in which they live or interact.
How does this square with our Christian faith? God’s revelation provides a perspective on the world that informs our study of communities and culture. This biblical and theological research combined with community research helps us apply biblical principles and develop practical ministries in the church and community.
This presentation is part of the larger series, Community Research and the Church. In the next segment, we explore the value and relevance of community research.

Ministry With Eyes Wide Open: The Varied Lenses of Community Research
From community-based participatory research to social-network analysis, there are various ways Christians can learn more about the communities they serve.
Photo credit: Hamilton Photography via Lightstock
Ministry with Eyes Wide Open: The Varied Lenses of Community Research
By Rudy Mitchell, Senior Researcher
Are you seeing all that can be observed about your community?
From community-based participatory research to social-network analysis, there are various ways Christians can learn more about the communities they serve.
In this presentation, we explore several approaches to community research:
Spiritual and religious assessment
Historical-research approach
Demographic approach with mapping
Community-based participatory research
Assets-based approach
Needs-assessment approach
Community-indicators approach
Leadership studies and stakeholder analysis
Case studies of organizations and best practices
Social-network approach
Systems-analysis approach
A number of these approaches can be used as part of an overall community-building or community-development process that leads to community transformation.
This presentation is part of the larger series, Community Research and the Church. In the next segment, we explore the nature of community research and how it relates to biblical research and Christian ministry.
Community Research and the Church
A Christian church or ministry functions in the context of a particular community. To effectively minister in that community, it’s important to understand it.
Photo Credit: Athena Grace via Lightstock
Community Research and the Church
by Rudy Mitchell, Senior Researcher
A Christian church or ministry functions in the context of a particular community. To effectively minister in that community, it’s important to understand it.
There are various ways Christians can learn more about the communities they serve. Community research provides us with the tools to go below surface observations. It lays a foundation for community transformation and effective witness.
In this series, we explore several facets of community research: different approaches, its nature, and its value and relevance to the church.
Illustrated Guide for Researching Your Community
From population trends to social needs, this illustrated guide lists the factors to consider when learning more about a local neighborhood or community.
Photo credit: Boston Heath via Lightstock
Illustrated Guide for Researching Your Community
by Rudy Mitchell, Senior Researcher
Click here for a template of a community research guide.
Community or Neighborhood Name:
Community geography
Clearly identify the boundaries of your community (geographical, political).
Identify the U.S. Census tracts of the community (unless you are covering a large area) or identify other defined areas used in population or demographic surveys.
Describe the main geographical features of the neighborhood or community. Describe any other basic defining characteristics or features. What key features (rivers, hills, waterfront, railroad, etc.) influence or define the nature and boundaries of the community?
Create or obtain a detailed map of the neighborhood or community. Add boundaries and use the base map to add other items of interest such as churches, schools, social service organizations, landmarks, cultural organizations, neighborhood associations, recreational facilities, and other resource assets. Separate maps can be created for different types of resources or institutions. You can also do this using layers in digital maps. You can use Google My Maps to create and share online maps. See google.com/mymaps. Another online option is to create a map in Harvard World Map, worldmap.harvard.edu, or Open Street Map, openstreetmap.org.

Grove Hall Boundaries and Census Tracts

Map of neighborhood churches
Examples of maps in a community study.


Map of Organizations and Programs in a Neighborhood

Key to map
Maps of schools, churches, and other institutions can be created, or these can be combined using symbols into one map.

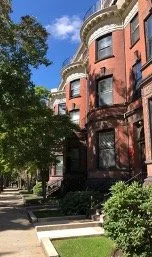
Hawthorne Grove, the Marshall P. Wilder Estate
Community History
Research the community’s history using primary and secondary sources, as well as oral history interviews. Aspects of community history may include biographical information on significant people; the history of the built environment; the history of religious and cultural organizations; economic and political history; and the history of ethnic, racial, and social changes. The history can be presented in narrative form supplemented with maps, charts, and visual illustrations.

Old Blake House, Edward Everett Square, Dorchester
Overall population and population trends
What is the current total population of the community or neighborhood?
What overall population trends have occurred in the last several decades? Include earlier data if available. Explore possible reasons related to the changes and possible future trends.
| Decade | 1990 | 2000 | 2010 | Latest |
|---|---|---|---|---|
| Total population | ||||
| % change from previous decade |
[The formula to find the % change is (B-A) /A x 100 =. Say the 1980 population (A) is 1,000 and the 1990 population (B) is 800. To find the % change from 1980 (A) to 1990 (B), begin on the calculator with B (800) and subtract A (1,000) then divide that by A (1,000) x 100, and then hit =. You should get -20. You can add the % sign to -20. The % change from A (1,000) to B (800) is -20%.] Source:

Example of a line graph showing the population trend for a neighborhood study.
Ethnic and Racial composition and trends of the community
Fill out this table for the major ethnic and racial groups in the community. (You may expand the table if you would like to include more groups, or you may combine smaller groups into an “Other” category.) Separate tables can be created for each census tract or for specific nationalities within the Hispanic group. Graphs and maps may also be used to visualize trends and changes. If the community has other nationalities and ethnic groups not listed in your table, you can list and describe them separately. Describe any intercultural or inter-racial tensions that exist. Summarize your observations and analysis of population trends.
| Name of group (ethnic group, racial group etc.) | 2000 | 2010 | Latest | pop. of group | % of total pop. | pop. of group | % of total pop. | pop. of group | % of total pop. |
|---|---|---|---|---|---|---|
| 1. | ||||||
| 2. | ||||||
| 3. | ||||||
| 4. | ||||||
| 5. | ||||||
| Total pop. | 100% | 100% | 100% | |||
The formula to find the percent is: A/Total x 100 =. Say there are 2,000 people (total) in your community, and 250 (A) are Hispanic. Put 250 (A) on your calculator, and divide by 2,000 (total) and multiply by 100 = 12.5. You can add the percent sign to your answer because you multiplied by 100. 250/2,000 x 100 = 12.5% of the people in your community are Hispanic. (Make sure your percentages total 100%.) Source:
From this table, how has the ethnic and racial composition of the community changed in the last few decades? Summarize your observations and analysis of population trends.
Describe any intercultural or inter-racial tensions that exist.
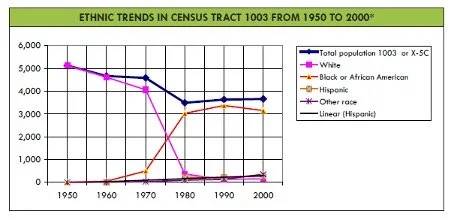
Example of a graph showing racial trends in a neighborhood.
Languages spoken and Linguistic Isolation
What languages are spoken in the community? Provide numbers per language.
What number and percentage of the population are linguistically isolated? ( A household is linguistically isolated if all members 14 years and older speak a non-English language and they speak English less than “very well.”) Of those who are linguistically isolated, what percentages speak various languages other than English? What percentage of the population over 5 years speaks English less than “very well?”

What are the age characteristics of the community’s population?
Complete the following table to reveal any important differences between the age profile of the church, community, and nation. Use your personal estimate or ask your pastor for the church data. (Figure the percentages and make sure they add up to 100.) Do the percentages differ significantly between the church, the community, and the nation?
| Age category | Your church | Community | Nation | Number | % | Number | % | Number | % |
|---|---|---|---|---|---|---|
| 0-4 years | ||||||
| 5-9 years | ||||||
| 10-19 years | ||||||
| 20-34 years | ||||||
| 35-64 years | ||||||
| 65+ years | ||||||
| Total | 100% | 100% | 100% | |||
The formula to find the percent is A/Total x 100 =. Say there are 200 people (total) in your church, and 25 (A) are youth. Put 25 (A) on your calculator, and divide by 200 (total) and multiply by 100 = 12.5. You can add the percent sign to your answer because you multiplied by 100. 25/200 x 100 = 12.5% of your church are youth.
What is the current median age of the population? Compare this with the median age of the nation, state, and larger city, or metropolitan area. Compare median age differences between different races in the community (and between the Hispanic and non-Hispanic populations).
Observe more specific characteristics of the teenage and young adult populations, such as the racial and ethnic composition. Break down the age groups by single years.
Which generations are represented in significant numbers in your church? Is one generation dominant?
Baby Boomers, born 1946-1964
Generation X, born 1965-1980
Millennials, born 1981-1996
Generation Z, born 1997-2012


Examples of graphs showing age profiles and comparisons of a neighborhood.
Family Characteristics and Marital Status
What is the average household size in the community? What is the average household size in the individual census tracts or subsections of the community? Observe any variations and also compare with the metropolitan area, state, and nation.
What are the numbers and percentages of the population (over 15 years) in your community who are:
| Marital status | Number | % |
|---|---|---|
| Now married (except separated) | ||
| Single (never married) | ||
| Separated | ||
| Divorced | ||
| Widowed | ||
| Total population (over 15 years) | 100% |
Source:
What percentage of families consist of (Compare to total population: A/total x 100 = %)
Married couples with children (under 18 years)? %
Married couples without children (under 18 years)? %
Households
What is the total number of households?
What percentage of households are family households?
What percentage of households are non-family households?
How do these percentages compare with the state and national percentages?
How many family households have children under 18 years?
How many of these family households with children under 18 are female-headed with no male spouse present?
How many of these family households with children under 18 are male-headed with no female spouse present?
What number and percentage of family households with children under 18 are single-parent households?
Number:
%:
What percentage of children under 18 years living in households, lived with
Grandparents:
Other relatives:
Non-relatives:
Economics and Income
Poverty
What percentage of the population is living below the poverty level?
What percentage of youth age 18 and under are living below the poverty level?
What percentage of youth ages 12-17 are living below the poverty level?
Families: What is the total number of families? What is the number of families living below the poverty level? What percentage of families live below the poverty level?
Comparisons: How do the percentages above compare with the city, state, and national percentages? Do some parts of the study area have higher rates of poverty than others?
Income
What is the median family income in this community?
What is the mean (average) family income in this community?
| 2000 | 2010 | Latest | |
|---|---|---|---|
| Community | |||
| Metropolitan area | |||
| State | |||
| Nation |
Trends
Has the general income of the community changed significantly relative to wider trends? (Middle income to lower income, or gentrification, etc.)
EMPLOYMENT
Major employers or types of employers in the community?
What is the present rate of unemployment? %
Have there been any changes in the type of employment, location of employment, or unemployment rates?
Education
Highest level of education: What percentage of all persons over 25 years old have
Less than high school?
High school?
Bachelor’s degree?
Master’s degree or higher
How do these percentages compare with the national and state percentages?

Example of a graph comparing educational achievements.
What is the current event drop-out rate for any high schools in the community?
Research the elementary and secondary educational institutions in the community.
List and describe each school. Provide any statistical data available.
List any postsecondary educational institutions and their enrollment.

Jeremiah Burke High School
Housing
What are the major housing types in the community based on your observation? (High-rise apartments or public housing; single-family detached houses, rowhouses, duplexes, triple-deckers, etc.)
What percentage of the housing units are owner-occupied? % (Compare to total)
What percentage of the housing units are low-income or affordable? % (Compare to total)
What is the median housing value for the community? For the nation?
Is the housing value increasing, decreasing, or stable?
What are the current typical monthly rental costs for a
Studio:
One-bedroom:
Two-bedroom:
Or more bedrooms
What housing needs and problems does the community have?
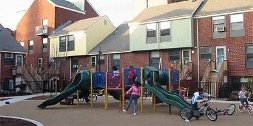

Recreation
List any important recreational facilities and activities in the community:
Source:
Community events
List major community events that occur annually or regularly:
Source:
Organizations
List any major community organizations, neighborhood associations, clubs, social, political, or educational groups:
Source:
Media
How are events in the community publicized?
Is there a community newspaper?
Source:
Social Needs
List any important Social Service Agencies and their services:
Source:
List three social needs that are not being effectively met by these groups.
Source:
What are the major crime concerns in the neighborhood?
Source:
Click here for a template of a community research guide.

Guide for Researching Your Community
From population trends to social needs, this guide lists the factors to consider when learning more about a local neighborhood or community.
Photo credit: JYount Photo via Lightstock
Guide for Researching Your Community
by Rudy Mitchell, Senior Researcher
Click here for an illustrated guide to researching your community.
Community or Neighborhood Name:
Community geography
Clearly identify the boundaries of your community (geographical, political).
Identify the U.S. Census tracts of the community (unless you are covering a large area) or identify other defined areas used in population or demographic surveys.
Describe the main geographical features of the neighborhood or community. Describe any other basic defining characteristics or features. What key features (rivers, hills, waterfront, railroad, etc.) influence or define the nature and boundaries of the community?
Create or obtain a detailed map of the neighborhood or community. Add boundaries and use the base map to add other items of interest such as churches, schools, social service organizations, landmarks, cultural organizations, neighborhood associations, recreational facilities, and other resource assets. Separate maps can be created for different types of resources or institutions. You can also do this using layers in digital maps. You can use Google My Maps to create and share online maps. See google.com/mymaps. Another online option is to create a map in Harvard World Map, worldmap.harvard.edu, or Open Street Map, openstreetmap.org.
Community History
Research the community’s history using primary and secondary sources, as well as oral history interviews. Aspects of community history may include biographical information on significant people; the history of the built environment; the history of religious and cultural organizations; economic and political history; and the history of ethnic, racial, and social changes. The history can be presented in narrative form supplemented with maps, charts, and visual illustrations.
Overall population and population trends
What is the current total population of the community or neighborhood?
What overall population trends have occurred in the last several decades? Include earlier data if available. Explore possible reasons related to the changes and possible future trends.
| Decade | 1990 | 2000 | 2010 | Latest |
|---|---|---|---|---|
| Total population | ||||
| % change from previous decade |
[The formula to find the % change is (B-A) /A x 100 =. Say the 1980 population (A) is 1,000 and the 1990 population (B) is 800. To find the % change from 1980 (A) to 1990 (B), begin on the calculator with B (800) and subtract A (1,000) then divide that by A (1,000) x 100, and then hit =. You should get -20. You can add the % sign to -20. The % change from A (1,000) to B (800) is -20%.] Source:
Ethnic and Racial composition and trends of the community
Fill out this table for the major ethnic and racial groups in the community. (You may expand the table if you would like to include more groups, or you may combine smaller groups into an “Other” category.) Separate tables can be created for each census tract or for specific nationalities within the Hispanic group. Graphs and maps may also be used to visualize trends and changes. If the community has other nationalities and ethnic groups not listed in your table, you can list and describe them separately. Describe any intercultural or inter-racial tensions that exist. Summarize your observations and analysis of population trends.
| Name of group (ethnic group, racial group etc.) | 2000 | 2010 | Latest | pop. of group | % of total pop. | pop. of group | % of total pop. | pop. of group | % of total pop. |
|---|---|---|---|---|---|---|
| 1. | ||||||
| 2. | ||||||
| 3. | ||||||
| 4. | ||||||
| 5. | ||||||
| Total pop. | 100% | 100% | 100% | |||
The formula to find the percent is: A/Total x 100 =. Say there are 2,000 people (total) in your community, and 250 (A) are Hispanic. Put 250 (A) on your calculator, and divide by 2,000 (total) and multiply by 100 = 12.5. You can add the percent sign to your answer because you multiplied by 100. 250/2,000 x 100 = 12.5% of the people in your community are Hispanic. (Make sure your percentages total 100%.) Source:
From this table, how has the ethnic and racial composition of the community changed in the last few decades? Summarize your observations and analysis of population trends.
Describe any intercultural or inter-racial tensions that exist.
Languages spoken and Linguistic Isolation
What languages are spoken in the community? Provide numbers per language.
What number and percentage of the population are linguistically isolated? ( A household is linguistically isolated if all members 14 years and older speak a non-English language and they speak English less than “very well.”) Of those who are linguistically isolated, what percentages speak various languages other than English? What percentage of the population over 5 years speaks English less than “very well?”
What are the age characteristics of the community’s population?
Complete the following table to reveal any important differences between the age profile of the church, community, and nation. Use your personal estimate or ask your pastor for the church data. (Figure the percentages and make sure they add up to 100.) Do the percentages differ significantly between the church, the community, and the nation?
| Age category | Your church | Community | Nation | Number | % | Number | % | Number | % |
|---|---|---|---|---|---|---|
| 0-4 years | ||||||
| 5-9 years | ||||||
| 10-19 years | ||||||
| 20-34 years | ||||||
| 35-64 years | ||||||
| 65+ years | ||||||
| Total | 100% | 100% | 100% | |||
The formula to find the percent is A/Total x 100 =. Say there are 200 people (total) in your church, and 25 (A) are youth. Put 25 (A) on your calculator, and divide by 200 (total) and multiply by 100 = 12.5. You can add the percent sign to your answer because you multiplied by 100. 25/200 x 100 = 12.5% of your church are youth.
What is the current median age of the population? Compare this with the median age of the nation, state, and larger city, or metropolitan area. Compare median age differences between different races in the community (and between the Hispanic and non-Hispanic populations).
Observe more specific characteristics of the teenage and young adult populations, such as the racial and ethnic composition. Break down the age groups by single years.
Which generations are represented in significant numbers in your church? Is one generation dominant?
Baby Boomers, born 1946-1964
Generation X, born 1965-1980
Millennials, born 1981-1996
Generation Z, born 1997-2012
Family Characteristics and Marital Status
What is the average household size in the community? What is the average household size in the individual census tracts or subsections of the community? Observe any variations and also compare with the metropolitan area, state, and nation.
What are the numbers and percentages of the population (over 15 years) in your community who are:
| Marital status | Number | % |
|---|---|---|
| Now married (except separated) | ||
| Single (never married) | ||
| Separated | ||
| Divorced | ||
| Widowed | ||
| Total population (over 15 years) | 100% |
Source:
What percentage of families consist of (Compare to total population: A/total x 100 = %)
Married couples with children (under 18 years)? %
Married couples without children (under 18 years)? %
Households
What is the total number of households?
What percentage of households are family households?
What percentage of households are non-family households?
How do these percentages compare with the state and national percentages?
How many family households have children under 18 years?
How many of these family households with children under 18 are female-headed with no male spouse present?
How many of these family households with children under 18 are male-headed with no female spouse present?
What number and percentage of family households with children under 18 are single-parent households?
Number:
%:
What percentage of children under 18 years living in households, lived with
Grandparents:
Other relatives:
Non-relatives:
Economics and Income
Poverty
What percentage of the population is living below the poverty level?
What percentage of youth age 18 and under are living below the poverty level?
What percentage of youth ages 12-17 are living below the poverty level?
Families: What is the total number of families? What is the number of families living below the poverty level? What percentage of families live below the poverty level?
Comparisons: How do the percentages above compare with the city, state, and national percentages? Do some parts of the study area have higher rates of poverty than others?
Income
What is the median family income in this community?
What is the mean (average) family income in this community?
| 2000 | 2010 | Latest | |
|---|---|---|---|
| Community | |||
| Metropolitan area | |||
| State | |||
| Nation |
Trends
Has the general income of the community changed significantly relative to wider trends? (Middle income to lower income, or gentrification, etc.)
EMPLOYMENT
Major employers or types of employers in the community?
What is the present rate of unemployment? %
Have there been any changes in the type of employment, location of employment, or unemployment rates?
Education
Highest level of education: What percentage of all persons over 25 years old have
Less than high school?
High school?
Bachelor’s degree?
Master’s degree or higher
How do these percentages compare with the national and state percentages?
What is the current event drop-out rate for any high schools in the community?
Research the elementary and secondary educational institutions in the community.
List and describe each school. Provide any statistical data available.
List any postsecondary educational institutions and their enrollment.
Housing
What are the major housing types in the community based on your observation? (High-rise apartments or public housing; single-family detached houses, rowhouses, duplexes, triple-deckers, etc.)
What percentage of the housing units are owner-occupied? % (Compare to total)
What percentage of the housing units are low-income or affordable? % (Compare to total)
What is the median housing value for the community? For the nation?
Is the housing value increasing, decreasing, or stable?
What are the current typical monthly rental costs for a
Studio:
One-bedroom:
Two-bedroom:
Or more bedrooms
What housing needs and problems does the community have?
Recreation
List any important recreational facilities and activities in the community:
Source:
Community events
List major community events that occur annually or regularly:
Source:
Organizations
List any major community organizations, neighborhood associations, clubs, social, political, or educational groups:
Source:
Media
How are events in the community publicized?
Is there a community newspaper?
Source:
Social Needs
List any important Social Service Agencies and their services:
Source:
List three social needs that are not being effectively met by these groups.
Source:
What are the major crime concerns in the neighborhood?
Source:
Click here for an illustrated guide to researching your community.

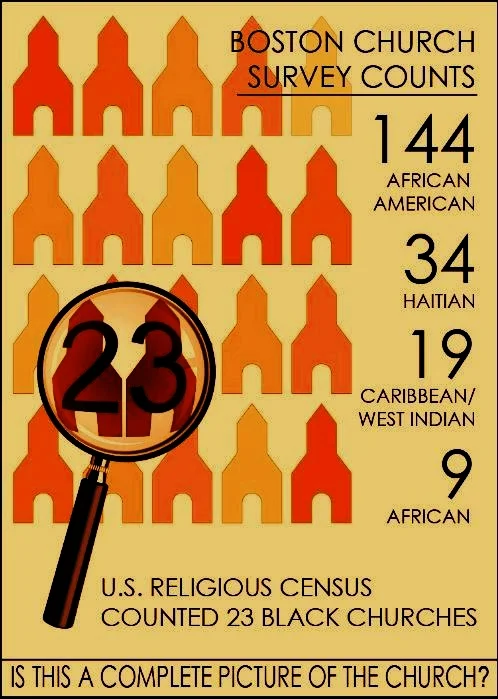
Capturing the stories of Black senior saints in Boston
The Black Church has a rich and living history in Greater Boston — a legacy that a new oral history project is capturing one interview at a time.
Capturing the stories of Black senior saints in Greater Boston
Boston Black Church Vitality Project’s oral history project
by Hanno van der Bijl, Managing Editor
The Black Church has a rich and living history in Greater Boston — a legacy that an oral history project is capturing one interview at a time.
It’s an initiative by the Boston Black Church Vitality Project in partnership with stakeholder churches that is exploring the intersection of being Black and Christian and the Church’s role in nurturing those identities.
Dubbed “Solos from the Choir,” participants record interviews with senior congregants, clergy, and community members. The project has already clocked in several interviews that have been posted online.
“These stories are centered around the Black church experience and to be honest with you, I would like to see more young people in church, so I’m hoping that these stories will encourage people to go to church because it’s such a place of community,” said Ritajayne Rivera, a member of Greater Framingham Community Church.
“I’m hoping that these stories will encourage people to go to church because it’s such a place of community.”
In addition to documenting the history of the Black Church and the Black Christian experience in Greater Boston, the endeavor seeks to inspire reflection, preserve tradition and give insight into assets and resources within churches.
The Black Church has historically been a place for Black people not only to worship but also to mobilize and organize for social change. It has served as a hub for social services, education, employment, voter registration, child care, and more.
By interviewing senior church members and recording their stories, the project is not only learning Black history but also preserving it.
TAKE ACTION
Is there an elder in your church or family who has a story to tell about the Black Church and the Black Christian experience in Greater Boston? This toolkit is available to guide you in the process of interviewing them about their experiences.

What does Boston's population growth mean for ministry in the city?
More and more newcomers are flocking to Boston even as the number of churches appears to be leveling off.
What does Boston's population growth mean for ministry in the city?
by Hanno van der Bijl, Managing Editor
More and more newcomers are flocking to Boston even as the number of churches appears to be leveling off.
The city's population is now growing at a much faster clip than in past years. From 1980 to 1990, the city added about 11,000 people. The increase grew to about 15,000 from 1990 to 2000. It doubled over the next decade to about 30,000 and then tripled from about 80,000 to 90,000 from 2010 to 2020.
The coronavirus pandemic threw a wrench in collecting data for the latest census. But taking into account recent growth trends, the Emmanuel Gospel Center estimates there are now about 700,000 Bostonians.

For much of Boston's past, the number of churches ran parallel to the city's population growth. That shifted in the 20th century during two periods of immigration from the 1870s to the 1920s and then again after 1980. During that time, the number of churches doubled from about 250 in the early part of the century to about 500 in 2000.
In recent years, that rate has slowed, creating new opportunities for Christian ministry.
“There are areas of the city that are seeing significant new developments and population growth, so, there’s opportunity for churches to do more outreach and for new churches to be planted.”
TAKE ACTION
What do you think are some implications of population growth for Christian ministry in Boston?


Understanding Boston: Background and History Reading List
There are many different aspects of Boston and, therefore, different perspectives and resources are needed to understand the city. Here is a list of resources and books for understanding the city’s background and history.
Understanding Boston: Background and History Reading List
by Rudy Mitchell, Senior Researcher
There are many different aspects of Boston and, therefore, different perspectives and resources are needed to understand the city. Boston has a long and rich history; a fascinating geographical and topographical development; strong educational, technical, and medical components; a history of activism, politics, protest, and organizing; a current and past mix of vibrant social and cultural groups; and a collection of distinctive neighborhoods.
One of the best ways to understand Boston is to walk around the city and its neighborhoods and engage in conversations with residents who have lived here for some time.
Felton, Robert Todd. Walking Boston: 34 Tours Through Beantown's Cobblestone Streets, Historic Districts, Ivory Towers and Bustling Waterfront, 2nd edition. Birmingham, Ala.: Wilderness Press, 2013.
Although this guide does not cover all neighborhoods, it has walks in quite a number of Boston’s neighborhoods.
Sloane, Robert, editor. WalkBoston: Walking Tours of Boston's Unique Neighborhoods. Boston: Appalachian Mountain Club, 2003.
Although this book is now aging, the active organization has a website – www.walkboston.org – with maps of the walks and other resources.
Books and other sources can also be helpful in broadening one’s perspective.
Top Five Books
Lukas, J. Anthony. Common Ground: A Turbulent Decade in the Lives of Three American Families. New York: Vintage Books, 1985.
O’Connell, Shaun, editor. Boston Voices and Visions. Boston: University of Massachusetts Press, 2010.
O'Connor, Thomas. The Hub: Boston Past and Present. Boston: Northeastern Univ. Press, 2001. Vrabel, Jim. A People’s History of the New Boston. Boston: University of Massachusetts Press, 2014.
Whitehill, Walter Muir, and Lawrence Kennedy. Boston: A Topographical History. 3rd edition. Cambridge: Harvard; Belknap Press, 2000.
RELATED: Top 5 Books for Understanding Boston
General and History
Allison, Robert J. A Short History of Boston. Beverly, Mass.: Commonwealth Editions, 2004.
Berenson, Barbara. Boston and the Civil War: Hub of the Second Revolution. Charleston, S.C.: The History Press, 2014.
Bostonian Society and Old South Association (now merged to become Revolutionary Spaces) The website - https://www.revolutionaryspaces.org/ - has videos related to Boston history and information on the Old State House and Old South Church. The organization holds important archival collections on Boston history.
Carr, Jacqueline Barbara. After the Siege: A Social History of Boston, 1775-1800. Boston: Northeastern University Press, 2005.
Howland, Llewellyn, III. A Book for Boston. Boston: David R. Godine, Publisher, 1980. Essays, stories and poems by various authors in honor of the city’s 350th anniversary.
Kay, Jane Holtz. Lost Boston. Expanded edition. Amherst, Mass.: University of Massachusetts Press, 2006.
In addition to 350 rare photos, this book contributes to understanding the history, development, and built environment of Boston through its narrative text.
Kirker, Harold, and James Kirker. Bulfinch’s Boston, 1787-1817. New York: Oxford University Press, 1964.
Klein, Christopher. Discovering the Boston Harbor Islands: A Guide to the City’s Hidden Shores. Boston: Union Park Press, 2011.
See also Snow, Edward Rowe. The Islands of Boston Harbor. Centennial edition. Updated by Jeremy D'Entremont. Boston: Commonwealth Editions, 2008.
Labaree, Benjamin Woods. The Boston Tea Party. Boston: Northeastern University Press, 1979 (Originally Oxford Univ. Press, 1964). For a shorter account, see Robert J. Allison’s The Boston Tea Party. Beverly, Mass.: Commonwealth Editions, 2007.
O’Connell, Shaun, editor. Boston Voices and Visions. Boston: University of Massachusetts Press, 2010.
O’Connor, Thomas. The Athens of America: Boston 1825-1845. Boston: University of Massachusetts Press, 2006.
Archer, Richard. As If An Enemy’s Country: The British Occupation of Boston and the Origins of Revolution. New York: Oxford University Press, 2010.
O’Connor, Thomas H. Civil War Boston: Home Front and Battlefield. Boston: Northeastern University Press, 1997.
O'Connor, Thomas. The Hub: Boston Past and Present. Boston: Northeastern Univ. Press, 2001. Philbrick, Nathaniel. Bunker Hill: A City, A Siege, A Revolution. New York: The Penguin Group, 2013.
Rogers, Alan, and Lisa Rogers. Boston: City on a Hill: An Illustrated History. Sun Valley, Calif.: American Historical Press, 2007.
Rutman, Darrett B. Winthrop’s Boston: A Portrait of a Puritan Town, 1630-1649. Chapel Hill, N.C.: University of North Carolina Press, 1965. Published for the Institute of Early American History and Culture.
Vrabel, Jim. A People’s History of the New Boston. Boston: University of Massachusetts Press, 2014.
A history of activism in Boston during the 1960s and 1970s. Vrabel reveals how grassroots leaders and the common people were involved in protests and community organizing which contributed significantly to the renewal of Boston.
Vrabel, Jim. When in Boston: A Time Line and Almanac. Boston: Northeastern University Press, 2004.
Very short descriptions of events year by year throughout Boston’s history.
Winsor, Justin, editor. The Memorial History of Boston. 4 volumes. Boston: Ticknor and Company, 1881.
This is the standard multi-volume history covering the years up to 1881.
Wright, Conrad Edick, and Katherine P. Viens, editors. Entrepreneurs: The Boston Business Community, 1700-1850. Boston: Massachusetts Historical Society, Northeastern University Press, 1997.
TAKE ACTION
Top 5 Books for Understanding Boston
Are you looking to get a better understanding of the city of Boston with all its history, neighborhoods, and eccentricities? Rudy Mitchell, researcher of Boston's neighborhoods and churches for over 30 years, gives his top 5 recommendations for books about Boston.
Top 5 Books for Understanding Boston
BY RUDY MITCHELL, Senior Researcher, Applied Research and Consulting
No one book or even a handful of books can fully cover the many facets of the city of Boston over its nearly 400 year history. Many books cover highly specific topics, present photographic highlights, or serve an academic readership. However, the following five books give distinctive insights, diverse perspectives, and general overviews. I recommend these five because they provide a variety of viewpoints, are general in nature, and can best serve most readers in understanding Boston.
A PEOPLE’S HISTORY OF THE NEW BOSTON
BY JIM VRABEL

Although many books about Boston focus on the city’s mayors, urban planners, and prominent leaders, Vrabel focuses on community activists, the poor, and working class men and women whose protests and community organizing played an unsung role in shaping the “New Boston” over the last fifty years. This important book, based on many interviews and extensive research, covers a range of issues from housing and urban renewal to education and jobs, as well as protests against a proposed Southwest Expressway and airport expansion.
COMMON GROUND: A TURBULENT DECADE IN THE LIVES OF THREE AMERICAN FAMILIES
BY J. ANTHONY LUKAS

The Pulitzer Prize winning Common Ground probes the roots of issues related to race, class, educational disparity, and income inequality which are still critical to understand and address. This brilliant work of historical nonfiction reads like an epic novel. In the foreground are three families: the black Twymons, the Irish McGoffs, and the Yankee Divers. The larger picture is not limited to Boston during the decade of court-ordered school integration through busing of students, although the book brings that era to life in intimate detail. Lukas paints a complex picture rich with details and explorations into the historical roots of the issues. Great works like this often draw on the details of one specific place and time to understand the larger, enduring concerns of American society and its cities.
THE HUB: BOSTON PAST AND PRESENT
BY THOMAS O’CONNOR
The Hub is the best general, one volume history of Boston. O’Connor draws on a long career of research and writing about Boston to distill his insights on Boston’s resistance and adaptations to political, social, religious, and economic changes over the centuries. While creatively adapting to major changes, the city and its neighborhoods have maintained their distinctive and historical qualities without becoming frozen in time. However, O’Connor defines the current challenge facing the city as retaining “its own distinctive identity as a city whose moral standards, civic virtues, and intellectual accomplishments once inspired a nation (xiii).”
BOSTON VOICES AND VISIONS
BY SHAUN O’CONNELL, ED.

The editor of this anthology of historical and literary excerpts about Boston has selected richly descriptive pieces as well as selections that consider the high purpose and vision set forth for the city. These selections convey the flavor and everyday life of the city over the centuries, but also interpret, critique and praise the ideas, attitudes, and ideals of Boston. The book includes a wide range of authors from John Winthrop (1630), to Oliver Wendell Holmes (1831), to W.E.B. DuBois (1960), and Patricia Powell (2004).
BOSTON: A TOPOGRAPHICAL HISTORY. 3RD EDITION.
BY WALTER MUIR WHITEHILL AND LAWRENCE KENNEDY
While the title of this classic work may suggest a narrow focus, Whitehill’s book is actually an excellent introduction to the general development of Boston. The changing face of the Boston landscape and its built environment are concisely covered and generously illustrated with many pictures and maps. Some newer books go into more depth on the filling of the Back Bay and the process of urban renewal, but this work is especially helpful in understanding the first three centuries of central Boston history. Although the book does not cover the social and religious aspects of Boston in any depth, it provides a remarkable amount of detail about the city’s buildings and physical development, all in a very readable style.
For more recommended reading on Boston and its history as well as resources for walking the city, here is a fuller list of resources.
TAKE ACTION


Boston Housing: Facts and Resources
As we begin 2019, housing is a hot topic in every corner of Boston. Get oriented with some basic data about housing realities and resources in Boston.
Editor’s note: This resource was updated with the most recent research in May 2022.
Boston Housing: Data & Resource Guide
by Rudy Mitchell, Senior Researcher
Housing remains a critical and controversial community issue in Boston.
In the “Boston Housing Facts and Resources” guide below, we have compiled a list of resources with the latest information on housing data and plans, demographics, innovative models, organizations working in housing-related justice, and the mayor's Housing Innovation Lab.

Boston Housing Facts and Resources
Basic Facts
Total number of housing units in Boston: 301,702 (2020 Decennial Census)
Occupied units: 91.5% (276,057)
Vacant units: 8.5% (25,645)
Rental vacancy rate: less than 3%
Owner-occupied units in Boston: 96,502 (35.3%) (2016-2020 ACS 5 yr. est)
Renter-occupied units in Boston: 176,686 (64.7%) (2016-2020 ACS 5 yr. est)
Over 50% of Boston housing units were built in 1939 or earlier.
The percentage of owner-occupied housing increased from 33% in 2012 to 35.3% in 2020.
BPDA Board Approved Projects in 2021
Number of new Residential Units: 6,555
Number of new On-site Income Restricted Housing Units: 2,366
In Boston, the median owner-occupied home value was $581,000 in 2020, up from $395,000 in 2010 — an increase of $186,000.
In Greater Boston in April 2022, the median price for a single-family home hit $845,000, and the median price for a condo rose to $716,500, according to the Greater Boston Association of Realtors.
In Massachusetts, prices of single-family homes increased 28% between 2019 and 2021. (Kara Miller, Boston Globe, 12 May 2022).
Over 40% of renters pay more than 35% of their household income for gross rent.
Boston Housing Authority (BHA)
Kate Bennett, administrator
(617) 988-4000
“In total, BHA currently owns and/or oversees approximately 12,623 rental units of public housing in Boston and houses more than 25,000 people under the public housing program. BHA owns 63 housing developments. Of the 63 developments, 36 are designated as elderly/disabled developments and 27 are designated as family developments. Three of the 27 family developments have elderly/disabled housing on site and one of the elderly developments has designated units for families.
In addition to housing developments, BHA administers approximately 11,469 rental assistance vouchers, otherwise known as Tenant-Based Section 8 vouchers, that allow families to rent in the private market and apply a subsidy to their rent. A similar state program assists an additional 700 households. With this assistance, residents are able to pay approximately 30-40 percent of their income toward rent, and BHA pays the remainder. BHA helps provide housing to approximately 29,000 people under these programs. In addition, BHA provides subsidies to more than 2,100 households under its Section 8 Project-Based Voucher and Moderate Rehabilitation programs as well.”
Overall, the BHA is involved in assisting almost 60,000 people.
Finding Affordable Housing
The City of Boston website listing new and existing affordable housing units also has the link to sign up for the MetroList through which you can receive up-to-date information on new housing opportunities as well as housing programs and events. Some other resources for finding housing include the following Boston City webpages:
Resources
The Boston Foundation
The 2021 Greater Boston Housing Report Card recommends:
Build on recent legislative momentum around zoning and housing production by legalizing small-scale multifamily housing and expanding the mandate for multifamily zoning in MBTA communities.
Improve the quality and frequency of transit service, both to better serve transit-dependent populations and to better support new or planned housing development.
Advance housing equity by making local inclusionary zoning policies more universal and more effective and by advancing state and local policies that limit displacement.
Advance building techniques and strategies with great potential to reduce housing production costs.
City of Boston
Housing Boston 2030
Released in 2014, Housing a Changing City: Boston 2030 was former Mayor Marty Walsh’s original housing plan.
Housing Boston 2030: 2018 Update
By 2018, the original 2014 Housing plan was revised to account for the greater population growth that was being projected by 2018 and thus a need for even more new housing.
2020 Annual Report for HOUSING BOSTON 2030
According to the report, 3,300 new housing units were permitted in 2020, which included 1,023 income-restricted units.
In 2019, 40,933 students were living on campus or in university-provided housing, 9,917 lived off-campus in their family home, and 36,288 lived off-campus and not at home. 5,245 new beds were completed or were in the process of being built by 2020.
Quarterly Housing Progress reports on Housing a Changing City: Boston 2030
Boston 2030 includes quarterly reports for 2015 through 2018.
City of Boston Department of Neighborhood Development
26 Court St., 8th & 9th Floors, Boston, MA 02108-2501
617-635-3880
The Department of Neighborhood Development works with communities to improve Boston’s neighborhoods through investing public resources. Its main jobs are to create housing options, support tenants, foster homeownership, end homelessness, and manage the City’s real estate.
Imagine Boston 2030 Housing Goals
General goal: Reduce housing cost burden for Bostonians.
Decrease portion of low- and middle-income households that are severely housing-cost burdened.
Initiatives to encourage housing production, increase affordable housing options, and reduce displacement. The city seeks to:
Work to increase overall housing supply.
Deploy a suite of tools to support the preservation of affordable housing citywide.
Pursue policies that encourage the production and maintenance of deed-restricted low-, moderate-, and middle-income housing.
Aspire to higher levels of affordability in geographies where this is feasible.
Stabilize housing and reduce displacement. (The City established the Office of Housing Stability to prevent evictions, foreclosures, and displacement.)
Partner with neighboring municipalities to identify and consider regional solutions to housing challenges.
Support homeownership by: › Assisting moderate- and middle-income Bostonians to purchase and maintain their first home through a variety of homebuyer and homeowner programs including prioritizing pathways to homeownership for tenants.
Community Preservation Act
A significant amount of money is now available from this tax supplement.
Thadine Brown, director, THADINE.BROWN@BOSTON.GOV
617-635-0545
Churches may apply for Community Preservation Funds (with some limitations). Examples: Charles St. AME, Roxbury Presbyterian, and Second Church in Dorchester. Grants will be made available for three types of initiatives or projects:
Affordable housing
Historic preservation
Parks, outdoor recreation, and open spaces
The Mayor’s Housing Innovation Lab
It seeks to increase housing affordability by testing innovative housing models and accelerating the pace of innovation in the housing sector.
26 Court St., 11th Floor, Boston, MA 02108-2501
617-635-0259
Projects of the Housing Innovation Lab:
Plugin House Initiative: The Plugin House demonstrates the possibilities of backyard homes and smaller living to provide housing affordable to all.
Housing with Public Assets: Could building housing on top of, or next to, city buildings, such as libraries and community centers, benefit our communities?
Intergenerational Homeshare Pilot: We’re offering affordable housing to graduate students while helping local homeowners and communities. This plan aims to encourage age-friendly development in the City. We’re also exploring different housing options in communities through a “Homeshare” network. This network matches older homeowners with extra rooms to rent to people who need to rent a room. This uses the Nesterly housing app.
Additional Dwelling Unit Pilot: This pilot program seeks to streamline the process for homeowners looking to create an additional unit. This 18-month pilot program allows owner occupants in East Boston, Mattapan, and Jamaica Plain to carve out space within their homes to create smaller, independent units, known as Additional Dwelling Units (ADUs). The program aims to help homeowners take advantage of the existing space in their homes, which can help people age in place and prevent displacement.
Urban Housing Unit Roadshow: Through our interactive exhibit, we heard from the Boston community about what they think about compact-size living units. The Urban Housing Unit was a compact apartment on wheels. The Housing Innovation Lab took it from downtown Boston to Roslindale, Mattapan, Dorchester, Roxbury, and East Boston. The 385 square-foot, one-bedroom unit was modular and fully furnished. Evidence shows that smaller, modular units can be built much cheaper than traditional housing.
Housing Innovation Competition: The Lab asked development teams to propose innovative compact living designs. The goal of the competition was to show that small, affordable family units are feasible. The competition took place from November 2016 to June 2017. This wasn’t just an ideas competition. The subjects of the competition were five city-owned properties in the Garrison Trotter neighborhood in Roxbury. The winning proposals in the competition would be built there.
Density Bonus Pilot Program: This pilot initiative allowed developers in the program to increase the height or floor area of their units. In exchange, they would restrict the income on a percentage of their residential units. The City created new density bonus zoning for the Strategic Planning Areas of PLAN: JP/Rox and PLAN: Dot Ave. This seeks to increase the number of affordable housing units.
Simplifying the Homebuying Process: After research with recent first-time homebuyers, the Housing Innovation Lab developed a framework to better support first-time buyers through the complex process. This framework keeps in mind the unique paths different individuals take in buying a house. The results were put into use by the Boston Home Center.
The Boston Home Center
26 Court St., 9th Floor, Boston, MA 02108
617-635-4663
The Boston Home Center is the City’s one-stop-shop for homebuyers and homeowners. The Boston Home Center helps Boston residents purchase, improve, and keep their homes. We offer training, financial help, and counseling to first-time homebuyers, guidance and funding for homeowners for home improvements, and counseling to help families avoid foreclosure. The Home Center also markets homes developed for income-eligible, first-time homebuyers. The website also has information on current home-buying lottery drawings for income-eligible families.
Other Organizations
Boston Neighborhood Community Land Trust
550 Dudley St., Roxbury, MA 02119
(617) 237-6015
Meridith Levy, executive director, mlevy@bnclt.org
Mission: “Boston Neighborhood Community Land Trust works to combat displacement and racial injustice by creating permanently affordable, community-controlled housing in the Boston area, with a specific geographic focus on Roxbury, Dorchester, and Mattapan. BNCLT builds neighborhood stability, housing equity, and community strength among low- and moderate-income residents most at risk of displacement; and through the collective strength of partners working toward a shared, equitable, and just future.”
Massachusetts Affordable Housing Alliance (MAHA)
1803 Dorchester Ave., Dorchester MA 02124
617-822-9100
Symone Crawford, executive director
MAHA’s mission is to educate and mobilize to increase affordable homeownership opportunities, break down barriers facing first-time and first-generation homebuyers, and close the racial-wealth and homeownership gaps.
The Massachusetts Housing Partnership (MHP)
160 Federal St., Boston, MA 02110
617-330-9955; Toll-Free 877-MHP-FUND
A statewide public nonprofit affordable housing organization that works in concert with the Governor and the state Department of Housing and Community Development (DHCD) to help increase the supply of affordable housing in Massachusetts.
See also the MHP One Mortgage Program.
Massachusetts Area Planning Council (MAPC)
60 Temple Place, Boston, MA 02111
617-933-0700
The Metropolitan Area Planning Council (MAPC) is the regional planning agency serving the people who live and work in the 101 cities and towns of Metropolitan Boston. Its mission is to promote smart growth and regional collaboration. Its regional plan, MetroFuture, guides its work as it engages the public in responsible stewardship of the region’s future.
MAPC recently released a new long-range regional plan for Greater Boston, called MetroCommon 2050.
The housing chapter of this plan recommends these goals:
Homes for Everyone
Ensure that people of all races and income levels have equal access to affordable housing through homeownership and rental opportunities.
Ensure adequate protections against displacement for communities and residents of color, low-income communities, and renters.
Accelerate the production of diverse housing types, particularly deed-restricted affordable housing, throughout the region.
The Planning Council produced an influential report on projected population and housing trends: Reardon, Tim, and Meghna Hari. “Population and Housing Demand Projections for MetroBoston,” 2014.
“To help the region and its communities plan for a changing and uncertain future, MAPC has prepared projections of population change, household growth, and housing demand for Metro Boston and its municipalities. ... More than 400,000 new housing units — mostly multifamily, and mostly in urban areas — will be needed by the year 2040 if the region is to keep growing its economic base.”
Boston’s Inclusionary Development Policy (IDP)
This city policy requires that developers of buildings with 10 or more units seeking zoning relief or building on City of Boston-owned land set aside a percentage of their units as affordable to moderate- to middle-income households. The IDP leverages resources from the strong private housing market to build or finance affordable housing. Any proposed residential development of 10 or more units that is either (1) financed by the city, (2) on property owned by the city or BPDA/BRA, or (3) that requires zoning relief must designate 13% of the total number of units on-site as affordable units. The developer may meet the requirement under certain conditions with special approvals by a financial contribution to the IDP Fund. Another alternative allows the developer to create new affordable units separate from but within the vicinity (within one-half mile) of the project in an amount equal to or greater than 18% of the total number of units.
The term that units will remain affordable is generally 30 years with the city’s right to extend that another 20 years. The policy contains various details defining affordability and financial details for three zones of the city (Zone A: downtown; Zone B: middle zone; and Zone C: outer neighborhoods). In general, affordability is calculated on percentages of income compared to the Area Median Income (AMI).

Over the life of the program, developers have directly created 2,599 income-restricted units, and IDP funds have created 1,414 income-restricted units. Thus, the IDP policy has resulted in 4,013 income-restricted housing units in Boston. If the restricted units have higher percentages of the AMI, they may still not be affordable to some lower-income residents.

Habitat for Humanity, Greater Boston
240 Commercial St., 4th Floor, Boston, Massachusetts 02109
(617) 423-2223
James Kostaras, president and CEO
Retail Outlet: ReStore (Habitat’s Donation and Home Improvement Outlet store)
1580 VFW Parkway, West Roxbury, MA, 02132
617-327-1170
A faith-based, charitable nonprofit organization dedicated to building simple low-cost homes by forming partnerships with low-income families in need of decent and affordable housing. Habitat for Humanity believes homeownership is a vital step to help families break the cycle of poverty and contributes to pride in families and communities.
Mission Statement: Seeking to put God’s love into action, Habitat for Humanity brings people together to build homes, communities and hope.
Habitat for Humanity Greater Boston builds strength, stability, and self-reliance through shelter. They bring people together to build homes, communities, and hope by revitalizing neighborhoods, building sustainable and affordable housing solutions, and empowering families through successful homeownership.
Through volunteer labor and tax-deductible donations of money, land, and materials, Habitat Greater Boston builds simple, decent houses. Families are selected based on their level of need, willingness to partner, and ability to repay a mortgage. They complete 300 hours of sweat equity by helping to construct their future home or working in other capacities alongside staff, volunteers, and sponsors. They also participate in homeowner education classes, like financial management and estate planning. Qualified families purchase Habitat homes with no down payment and pay an interest-free mortgage to Habitat, which enables them to afford owning their own home.
Habitat’s ReStore Outlet receives donations and either uses them in the homes they build or resells them at 50-70% off retail to the general public. These items include building and construction materials, home furnishings, and appliances, etc. Sales help fund new homes.
Habitat Greater Boston is a participant in the Neighborhood Revitalization Program. They are taking a holistic approach to creating change in our neighborhoods that have the greatest need for stability. This means joining residents, nonprofits, businesses and local government to discover what is needed most in a neighborhood, and helping to implement a shared vision of revitalization. Our focus neighborhood is Codman Square in Dorchester. They have partnered with the Codman Square Neighborhood Council to identify important ways to improve the neighborhood and surrounding areas.
Habitat has mobilized volunteers and future homeowners to build homes in Dorchester, Roxbury, Roslindale, South Boston, Mission Hill, and other communities. Although they only work on a few projects each year, they keep building year after year, resulting in many homes being built over the last 25 years with and for low-income families.
Additional Resources
Where to Plant a Church in Boston: Areas of Growth
Want to know where to plant a church in Boston? You might consider Boston’s newest or soon-to-be-built residential growth sites. We’ll take a look at eight neighborhoods where growth is—or soon will be—taking place, based on public and private development plans.
Where to Plant a Church in Boston: Areas of Growth
by Rudy Mitchell and Steve Daman
Want to know where to plant a church in Boston? You might consider Boston’s newest or soon-to-be-built residential growth sites. New neighborhoods and new residents mean new opportunities for planting new churches.
Take a look at these eight neighborhoods of current or immanent growth, based on public and private development plans. Given the general population trends, these are priority areas for outreach and new churches.

Map showing plans for potential expanded neighborhoods, from Imagine Boston Expanding Opportunity, City of Boston, Draft November 2016, p. 25
Neighborhood change is ongoing. Boston’s new neighborhood development will not happen all at once. Some areas have residential developments in process or already completed, like the Seaport District, the South End, Jamaica Plain, and to some extent Allston-Brighton. Other areas, like South Boston and Charlestown, already have many new young professionals and some new housing, but much more will be built in the next five years. Other areas, specifically Suffolk Downs and the Beacon Yards part of Allston, will most likely take more than five more years to develop.
Your geographic and demographic focus. Of course, reaching into newer neighborhoods is not for everyone. Ministry leaders should prayerfully select their geographic focus and adapt their strategies to the types of residents they are called to serve. The church in the city can be adapted in countless ways, and church planters can reach and serve a diversity of current and newer residents because the Gospel is for all people. Congregations may—by their form, style, or language—be better equipped to reach specific groups of people with whom they can make the most impact.
Church planters seeking primarily to reach specific immigrant groups like Nigerians, Brazilians, or Vietnamese, for example, need to know where these nationalities are more concentrated. Churches seeking to serve college students need to find meeting space within walking distance of campuses or in reach of public transportation while being sensitive to the needs, concerns and culture of students. Leaders seeking to reach and serve Boston’s new population growth areas will need to take the time to understand the characteristics, cultures, work, and interests of the people who will be living there.
Here’s a look at eight of the bigger residential development areas across the city:
1. Seaport District by the Waterfront. While there are many new high-rise housing and office buildings being built here, there are very few churches in the area.


2. South End. The northeastern and eastern parts of the South End from the Ink Block to the Boston Medical Center between Albany and Washington Streets will soon have hundreds of new apartments and condos which are being planned and built. Will the South End churches be ready?

3. South Boston from Andrew Square to the Broadway MBTA stations. Although still in the future, “Plan: South Boston Dorchester Avenue” calls for 6,000 to 8,000 new housing units. DJ Properties is also building Washington Square, a mixed use development near Andrew Station with 656 residential units. The nearby Widett Circle and New Market/South Bay areas are also potential major development sites proposed by the City of Boston. Currently there are already many new housing units and new residents around Broadway and in South Boston generally. The neighborhood has few Protestant churches.


Nine-building Washington Square Development with 656 residential units approved and to be completed in the next four years.
4. Charlestown – Sullivan Square and other areas. The Sullivan Square area is one of the six main areas the City of Boston has proposed for major housing expansion. Meanwhile the 1,100 units of the Bunker Hill Housing Development will be totally redeveloped into 3,200 units of mixed housing. Charlestown has very few Protestant churches.


Bunker Hill Housing Development Plans
5. Allston Brighton – Beacon Yards. This is one of the six major areas proposed by the City for development into new expanded neighborhoods. The Boston Landing Campus of New Balance is an area with new residential units and Stop & Shop will be building 1,000 new housing units. Other major housing developments are in the works as well.

Boston Landing in Allston near New Balance (NB Development Group and HYM)

Residential development with 295 units for 2018 opening.
6. Roxbury – from Dudley Square area to Ruggles MBTA station. Coming up in the next several years is the recently approved $500M Tremont Crossing development with over 700 apartments. The nearby Whittier St. Housing Project received funding for a full redevelopment into an expanded mixed income development. Other significant residential developments are also in the works, and Northeastern University is expanding in the area with high-rise dorms.

Tremont Crossing, just one mile from EGC

Whittier Choice redevelopment with 387 units of mixed income housing in three new buildings.

Whittier Choice redevelopment near Ruggles Station.
7. Jamaica Plain – Forest Hills Station. This area is booming with several large new housing developments in various stages of planning and completion. Also, the nearby Washington Street corridor recently completed a new (and controversial) plan which includes potential new residential development in addition to what is already being built in the area. Although there are some thriving churches in this area, because there will be so many new residents there is room for more churches not only here, but throughout Jamaica Plain.

The Residences at Forest Hills

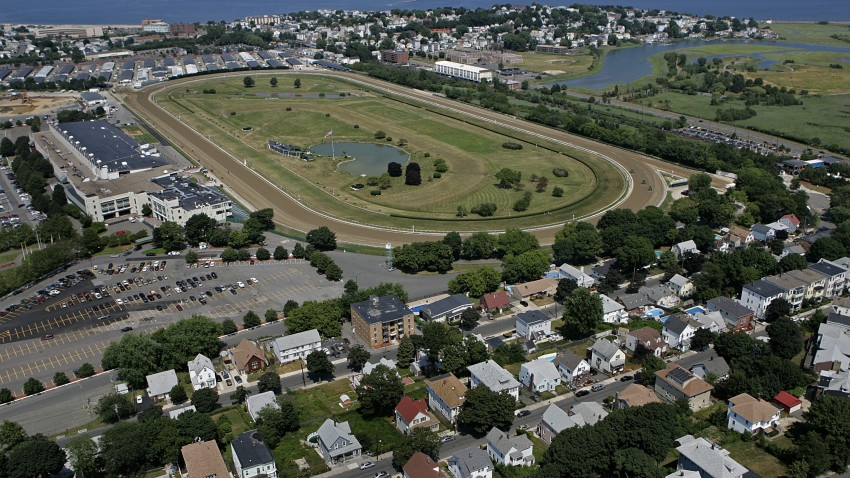
8. Suffolk Downs. In the future, this former racetrack will likely become a whole new community. This massive 161-acre site is one of the six major areas proposed by the city for expansion, and was recently purchased by a developer, HYM Investments. This could become one of the largest developments in the whole region.
Planting now for future harvest. As these new communities emerge across the city, the need to plant new congregations should be high on the list for Christians in Boston as we think about the witness and work of the Kingdom of God over the next few decades.
Take Action
Learn more about the City’s plans for housing new residents.
Connect with the Greater Boston Church Planting Collaborative.


A Bigger Fire: 2018 New England City Forum
Shared vision of God’s call is building across New England. But we need to get out of our silos to see it. UniteBoston’s Kelly Steinhaus shares themes emerging from the 2018 New England City Forum.
A Bigger Fire: 2018 New England City Forum
By Kelly Steinhaus, Director of UniteBoston
New England has the reputation of lacking a Christian presence. But my experience shows otherwise—Christians in New England are some of the most faith-filled, gospel-driven people I’ve ever met.
At times, I get discouraged by what I think I should see of gospel impact in New England. But when I come together with other Christian leaders, my perspective changes. I get filled with faith and excited about how God is at work in our midst.
For this reason, I love working with UniteBoston and the New England City Forum. Within the walls of our churches and church networks, we can feel isolated. Coming together, we can see the larger story of God’s movement emerging.

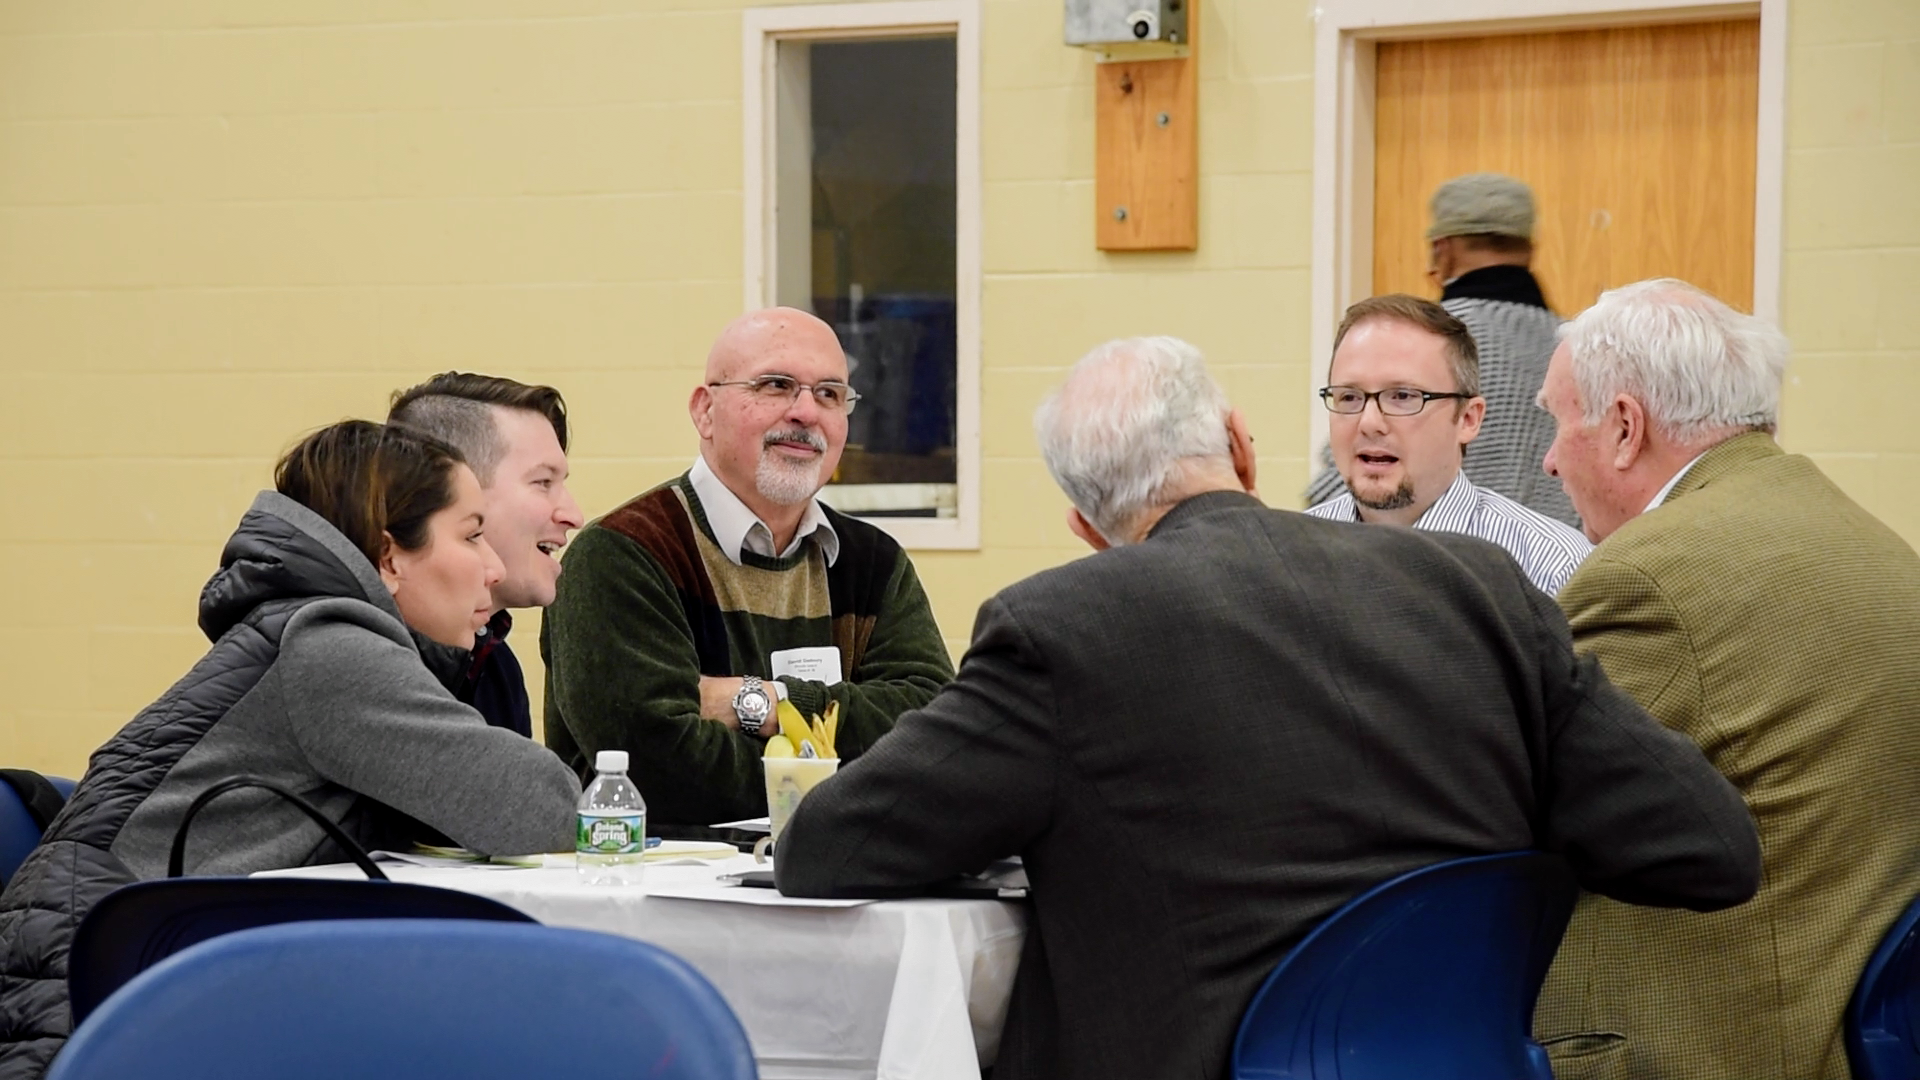
Learning Together at the New England City Forum
This year’s City Forum brought together 96 leaders from 17 cities throughout New England. Many participants expressed to us how refreshing it is to be with people from different settings with similar visions and goals.

We heard city presentations in the morning from New Haven and Springfield. In the afternoon, we hosted a “world cafe” style discussion, where people chose topic tables to discuss and collaborate on how to advance the gospel in New England.
We then asked participants in the forum to share with us what they took from the day that would most impact their ministry. Here’s what we learned.


1. God is on the move across New England—but we don’t hear about it.
We asked participants why they came to the forum. The most frequent reason they shared was to discover what God is doing more broadly in New England.
“I felt led to get out of my comfort zone and engage with others,” said one, wanting to “know New England better and what God is doing here.” Another attended “to learn about what God is doing in New England and meet some of the people He’s doing it through.”
Looking back over the day, one participant responded with the observation, “God is doing much in terms of our cities/movements. Most Christians are unaware beyond their own church, much less in other New England cities.” Another came away with the conviction that “God is moving—stay the course.”
2. Collaboration is the next normal.
Both of the city reports from New Haven and Springfield stressed the need for collaboration. Collaboration is celebrating the uniqueness of each community while partnering across differences.
“God has given charisma to all the churches, so we need to ask for them and each other,” shared one, acknowledging our need, “to humble ourselves and stop saying to other parts of the body, ‘I don’t need you.’”
Another added that we need collaboration across denominational, racial and socio-economic lines for the Church to “fulfill her calling and fully grow into her potential,” so that “revival can become a reality.”
Through Christ, we're all adopted into God’s family, and thus we are all on the same team—like it or not. So we have to be intentional about partnering across the beautiful diversity of Christ’s Church: across race, denomination, and generation, to name a few.
Rather than individually blowing on our own fires and hoping for success, it is time for us to take down the walls and come together to build a bigger bonfire. As we humbly open our hearts for greater partnership, a vision bigger than preserving our individual ministries will emerge.

I believe such unity is a tangible sign of the “revival” for which many have been longing and praying. To this end, the Luis Palau Association’s City Gospel Movement website was recently launched to help people to connect with gospel-oriented collaboration throughout the nation.


3. Building diverse leadership and sharing power are essential.
Building kingdom collaboration requires diverse leadership. To make this goal a reality, we must commit both to racial reconciliation and power-sharing.
After viewing a video of Christena Cleveland, which emphasizes Jesus’ way of the first to be last, many participants echoed the need to develop diverse leadership.

Watch Video
“Racial reconciliation can be modeled by pastors becoming friends,” wrote one participant, “learning to trust one each other and serving together as individuals and churches.”
Another responded in the form of a prayer, “God, please give me the heart and mind that is curious to genuinely seek to hear the power and truth of the person in front of me.”

Working together across our differences isn’t easy. As Pastor Todd Foster of the New Haven multi-church collaboration Bridges of Hope observed, “Being in the same room doesn’t mean you’re on the same page.” In his experience, we need to deal with the issues intentionally if we are to tear down the necessary walls.
But a fuller movement of God will come when we take the next step beyond mutual understanding. Real momentum will come when, as one participant shared, we become “ruthless about developing diverse organizational/neighborhood leaders,” with a commitment to “share the airtime.”
I’m convinced that if there is one thing needed in New England, it's a humble willingness to lay down our power to serve one another. I believe now is a God-ordained season where we must recognize we need one another like never before.

When we asked how we could improve the forum, many people suggested taking steps towards greater diversity among forum participants on various dimensions—ethnicity, vocation, and cities represented.
Internally, we’ve also held multiple conversations about what it could look like to develop more diverse leadership within the forum and ways we have not yet hit our own marks.
Looking Forward
Each Christian—each church—is a part of something much bigger than we can see. A united vision emerges the more we come together. The Emmanuel Gospel Center, Vision New England, and UniteBoston are committed to supporting unity-focused collaborations and creating spaces to learn from one another.

We’re grateful to NECF hosts and participants for fruitful conversations over the past three years. We’ve been encouraged to hear what God is doing and privileged to connect leaders in a shared learning space.
At this point, we do not plan to reconvene the New England City Forum next year. Instead, our team would like to take some time to reassess God's leading as we support more learning opportunities for Christians across ethnicity, vocation, denomination, and New England geography. We welcome your input.
We are grateful for your participation in the New England City Forum and are eager to see how the Lord will bring us together again in the future.


Understanding Jamaica Plain Today: Overview + Resources
Are you planting a church or ministering in Jamaica Plain? Get to know this vibrant neighborhood and explore some great local resources.
Understanding Jamaica Plain Today: Overview + Resources
by Rudy Mitchell, Senior Researcher
Affectionately known as "JP", Jamaica Plain's reputation includes diversity, friendly community, unique businesses, socially-conscious activity, increasing gentrification, and natural beauty.
JP is in a period of rapid growth. Hundreds of new residential units are recently completed or underway. The JP/Rox Plan for the Washington Street and Columbus Avenue areas is likely to bring additional changes in the coming years. While Jamaica Plain continues to transition into the future, its beautiful green spaces will keep it true to its nickname as the “Eden of America.”

Copper European Beech Tree at Forest Hills Cemetery, Jamaica Plain, MA. Photo licensed for public use.
JP AT A GLANCE
Residents by Race
Residents By Age
Educated More than 63% of Jamaica Plain residents 25 years or older have obtained a bachelor’s degree or higher. This is much higher than the percentage for the U.S. (30%) or Boston (45%).
Increasingly Young The proportion of 25-34 year olds in Jamaica Plain has risen from 23% in 2000 to 27% in 2015. The percentage of young adults aged 20 to 34 in Jamaica Plain is exactly the same as in Boston - 34.7% (a very high proportion). The median age of Jamaica Plain residents is 33 years compared to 39 years for Massachusetts.
Family Friendly Jamaica Plain had 6,719 children under the age of 18 years (6th highest number of children out of 22 Boston neighborhoods).
“Jamaica Plain has been a wonderful neighborhood for our family. JP is rich in diversity, full of green space, and yet densely urban and teeming with energy. It’s a neighborhood that cares a lot about the world and about building stronger community.
”

Rev. Brice Williams spent two years researching JP as a church planter. He lives in JP with his family and is the new pastor of the South End Neighborhood Church.
Language Diversity 8,611 Jamaica Plain residents speak Spanish at home (23.4% of the population); 765 residents speak Chinese at home; 586 speak French or Haitian Creole; 382 speak Portuguese or Cape Verdean Creole. About 23% of the population – 8,879 residents – are foreign born.
Income Inequality The poverty rate in Jamaica Plain is 18.3% with 7,039 people living below the poverty line. However, the median household income is a relatively high $76,968, which indicates significant income inequality between a large number of low income residents and many high income residents. Almost 63% of the neighborhood’s employed adults have occupations in management, business, science, and the arts.
“With all of its beauty, JP is also a neighborhood burdened with gentrification, miscommunication, and fragmentation. Be a cultural anthropologist. Be a community member before a Christian leader. Listen well and learn from men and women who have lived and built the story of JP as we see it today, no matter their religious background or bent.
”
Bike-Friendly Although most residents commute to work by car or subway, 1,318 people commute by bicycle, and 1,292 walk to work.
Natural Beauty

Jamaica Pond, Jamaica Plain, MA.
Jamaica Pond
One of the attractions of this neighborhood has always been Jamaica Pond, which is surrounded by a biking/walking trail. Beginning in the early years of the neighborhood’s history, residents built homes and summer estates which overlook the pond to this day.
In the past, ice skating was a popular recreation at the pond, while boating, fishing and jogging or walking continue to be enjoyed by many. In the late nineteenth century, the pond became a part of the Emerald Necklace designed by Frederick Law Olmstead. One popular activity today is the annual Lantern Festival.

Lantern Festival, Jamaica Pond, Jamaica Plain, MA.

Small pond within Arnold Arboretum. Photo by Daderot, English language Wikipedia.
Arnold Arboretum
Founded in 1872, the arboretum has one of the largest and best documented collections of woody plants in the world. More than 15,000 plants from some 4,000 species grow here. Among these are about 400 lilac bushes of 179 types featured every spring on Lilac Sunday. The arboretum’s 281 acres are managed by Harvard University and have been designated a national historic landmark. The residents of Jamaica Plain as well as Boston enjoy the unique beauty of the arboretum in all seasons.
Recommended Resources

Plan JP/Rox – Boston Planning and Development Agency
The PLAN: JP/ROX document provides recommendations and strategies around affordable housing, jobs and businesses, guidelines for urban design, and suggestions for improvements to transportation, connections, open space, sustainability, and the public realm in Jamaica Plain.
Jamaica Plain Neighborhood Council
Getting to Know Your Neighborhood: Jamaica Plain


Understanding Roxbury Today
At the geographic heart of Boston, Roxbury is home to a diverse community. Like many Boston neighborhoods, Roxbury is in transition—holding the tension between the beautiful old while welcoming in the beautiful new.
Understanding Roxbury Today
(header photo: Bruce C. Bolling Municipal Building, the new headquarters for Boston Public Schools, in Dudley Square, Roxbury. Photo courtesy of Wikimedia Commons.)
by Rudy Mitchell, Senior Researcher
Boston's Roxbury neighborhood is home to many of the city’s African American and Hispanic residents and offers many historic and contemporary assets to the city as a whole.
Community culture is celebrated through visual and performing arts, and in many houses of worship. Several parks, including Franklin Park with its Zoo, greenspace, and Golf Course, offer recreational outlets to the community. The Reggie Lewis Center offers space for exercise and a world-class track and field venue.


Gordon-Conwell Theological Seminary, Boston – The Center for Urban Ministerial Education (CUME) and Resurrection Lutheran Church in Dudley Square
As a result of several stages of community development and renewal, this neighborhood at the geographic center of the city is on the rise. New business and housing initiatives are renewing the Dudley Square and Grove Hall districts. Blue Hill Avenue is no longer a street full of vacant lots.
Like many Boston neighborhoods, Roxbury is in transition. Long-term residents seek to benefit from positive changes, while preventing displacement and other negative effects of development and potential gentrification.


Franklin Park, Hole #6, on the William J. Devine Golf Course
Roxbury Voice: Life in Roxbury
“I love it. I love living in Roxbury. I love the location. God created an optimum situation for us to move [here]. It’s worked for us as a family, as well as for ministry."
—Pastor Cynthia Hymes Bell, Director of Starlight Ministries

Pastor Cynthia Hymes Bell, Director of Starlight Ministries of Emmanuel Gospel Center
Cynthia moved into Roxbury in 2005 and has been deeply involved in the community up to the current day.
Residents of Roxbury
Residents By Race
Total Population – 51,714
Population Growth – Roxbury grew by 23% from 2000 to 2016, (doubling Boston's growth of 12% over the same time period).
Children – 29% of Roxbury residents are children (aged 0-19 years), higher than the 21% of Boston as a whole.
Female Householders – 34%. Roxbury, along with Mattapan, has the highest percentage (34.3%) of households headed by a female householder with no husband present of all Boston neighborhoods. The percentage for Massachusetts is 12.5%.
Foreign-born population – 14,006, or 27.1% in 2016, (up from 20.2% in 2000).
Language – 26% of Roxbury residents speak Spanish in the home.
Income – The median household income in Roxbury in 2016 was $26,883, which is less than half the Boston median of $58,769.
Black Culture – With over half of its residents identifying as Black/African Americans (compared to Boston’s 23%), Roxbury is still considered by many to be the heart of Black culture in Boston.

Roxbury Center for the Performing Arts website
The Museum of the National Center of Afro-American Artists (NCAAA) is a gateway that "fosters and presents the finest in contemporary, visual and performing arts from the global Black world. "
The Roxbury Center for the Performing Arts opened in 2005, and continues to celebrate the culture of the community through visual and performing arts.

The Roxbury International Film Festival is the largest film festival in New England that annually celebrates people of color.

The Roxbury Cultural District "identifies and recognizes Roxbury's cultural assets and establishes the tools, strategies, resources, and spaces that elevate the community of Roxbury as a living repository of arts and cultural expression—past, present, and future."
Roxbury Voice: Advice to Christian Leaders
“I’m planning to get more involved with my neighborhood association this year...to understand different viewpoints and political standpoints in regards to development...[housing and failing schools]...to show up at meetings and to have a voice."
— Pastor Cynthia Hymes Bell, Director of Starlight Ministries

Housing – Roxbury has an unusually large percentage of its housing units that are renter-occupied (80%) compared to owner-occupied (20%). This is the highest rate of any non-student neighborhood in the city. (The U.S. proportion of renter-occupied units is 36%.)
Roxbury has the third highest number of housing units of any Boston neighborhood – 20,779.
Roxbury’s growth is poised to continue, with 2,711 new units of housing approved from 2010 through 2017 (including new residential units being added to the Whittier Choice Neighborhood project). In addition, 626 additional residential units have been proposed and are under review. If all 3,337 units are built, this could add 8,500 or more new residents to the Roxbury neighborhood.

Roxbury Community College is a state-supported two-year coed liberal arts institution, founded in 1973.
Educational Attainment – From 2000 to 2016, the share of adult residents without a high school degree fell (32% to 25%) while the share with a bachelor’s degree rose (13% to 20%). Even though the percentage of college graduates increased, it is still the second-lowest of any neighborhood and far lower than the percentage of college graduates in most neighborhoods and Boston as a whole (46%).
(Primary source of data in this section: Boston in Context: Neighborhoods, Boston Planning and Development Agency (BPDA), March 2018, based on the 2012-2016 American Community Survey (ACS), U.S. Census.)

The Shirley–Eustis House is a National Historic Landmark, built in Roxbury as a summer residence between 1747 and 1751.
RECOMMENDED RESOURCES

Roxbury – Boston Planning and Development Agency
This site provides a short overview of Roxbury's history, as well as comprehensive details on the city's projects—past, present, and future.

To learn more about Roxbury's extensive history, visit this site. The Roxbury Historical Society headquarters are located at the Dillaway Thomas House in the Roxbury Heritage State Park.


Keywords
- #ChurchToo
- 365 Campaign
- ARC Highlights
- ARC Services
- AbNet
- Abolition Network
- Action Guides
- Administration
- Adoption
- Aggressive Procedures
- Andrew Tsou
- Annual Report
- Anti-Gun
- Anti-racism education
- Applied Research
- Applied Research and Consulting
- Ayn DuVoisin
- Balance
- Battered Women
- Berlin
- Bianca Duemling
- Bias
- Biblical Leadership
- Biblical leadership
- Black Church
- Black Church Vitality Project
- Book Recommendations
- Book Reviews
- Book reviews
- Books
- Boston
- Boston 2030
- Boston Church Directory
- Boston Churches
- Boston Education Collaborative
- Boston General
- Boston Globe
- Boston History
- Boston Islamic Center
- Boston Neighborhoods
- Boston Public Schools
- Boston-Berlin
- Brainstorming
- Brazil
- Brazilian
- COVID-19
- CUME
- Cambodian
- Cambodian Church
- Cambridge


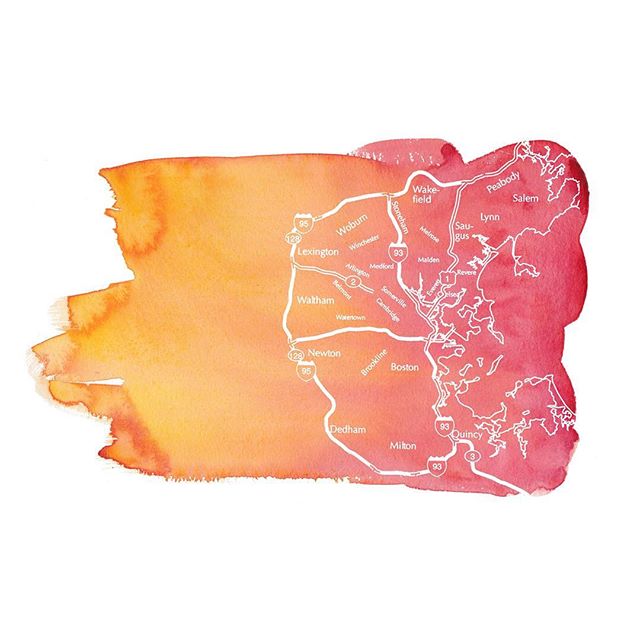


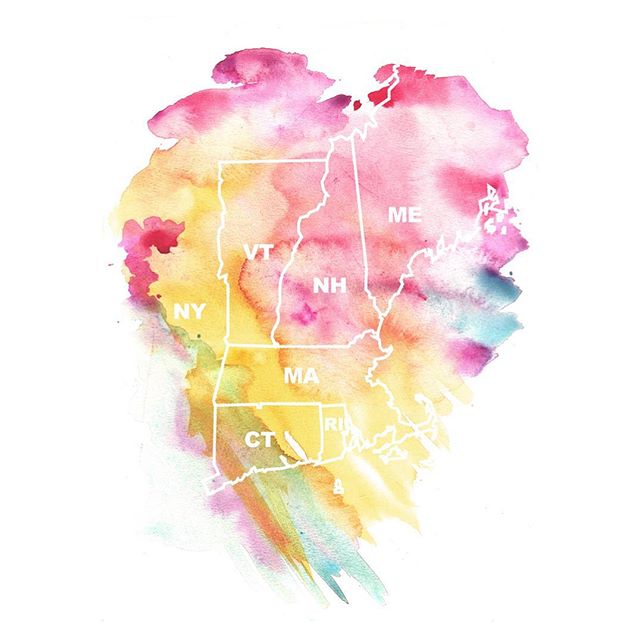
A frank look at the sources, accuracy, limitations, and weaknesses of some commonly used church statistics in Boston. As convenient and convincing as statistics are, they can be misunderstood, misapplied, and generate misinformation.